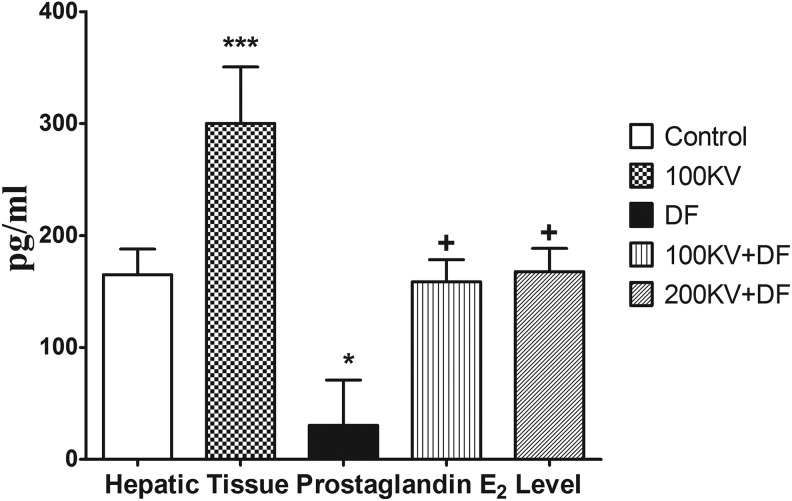
Figure 3.
Effect of KV on hepatic tissue prostaglandin E2 in DF-induced hepatorenal toxicity. Data are expressed as means ± SEM. *P < .05, **P < .01, and ***P < .001 significantly different from control; +P < .05, ++P < .01, and +++P < .001 significantly different from DF. #P < .05 significantly different from 200 KV. DF indicates diclofenac; KV, kolaviron; SEM, standard error of mean; 100KV, 100 mg/kg of kolaviron; 200KV, 200 mg/kg of kolaviron.

