
Figure 4. Energetics of interaction of the GRP1 PH domain with a PIP3-containing lipid bilayer.
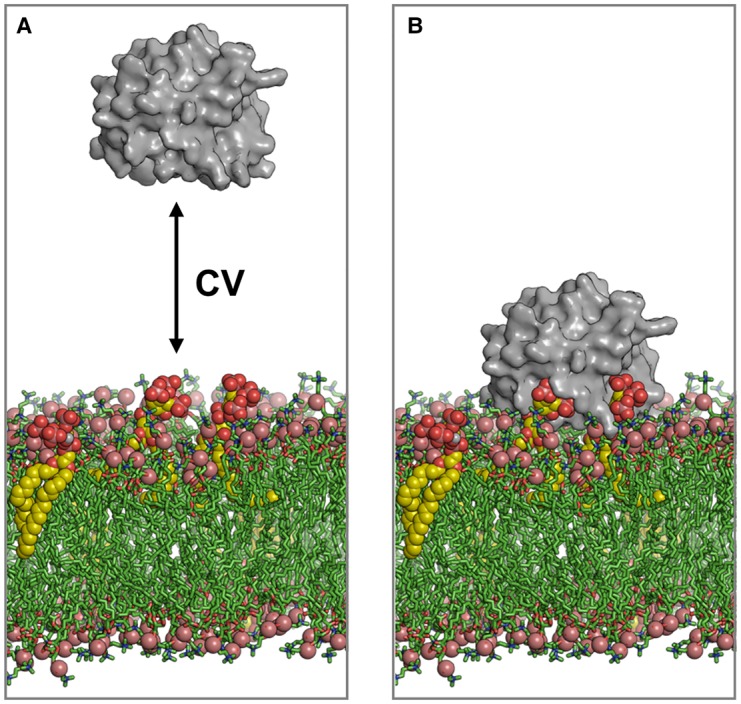
(A) Simulations of the interaction of the GRP1 PH domain (grey) with a lipid bilayer. The double-headed arrow indicates the reaction co-ordinate for estimation of the free energy landscape (PMF) as a function of the distance of the PH domain from the target lipid molecule(s). (B) The GRP1 PH domain is shown bound to a PIP3-containing bilayer. PIP3 molecules are shown as yellow spheres. Lipids are shown as green sticks. Simulation co-ordinates from [95].