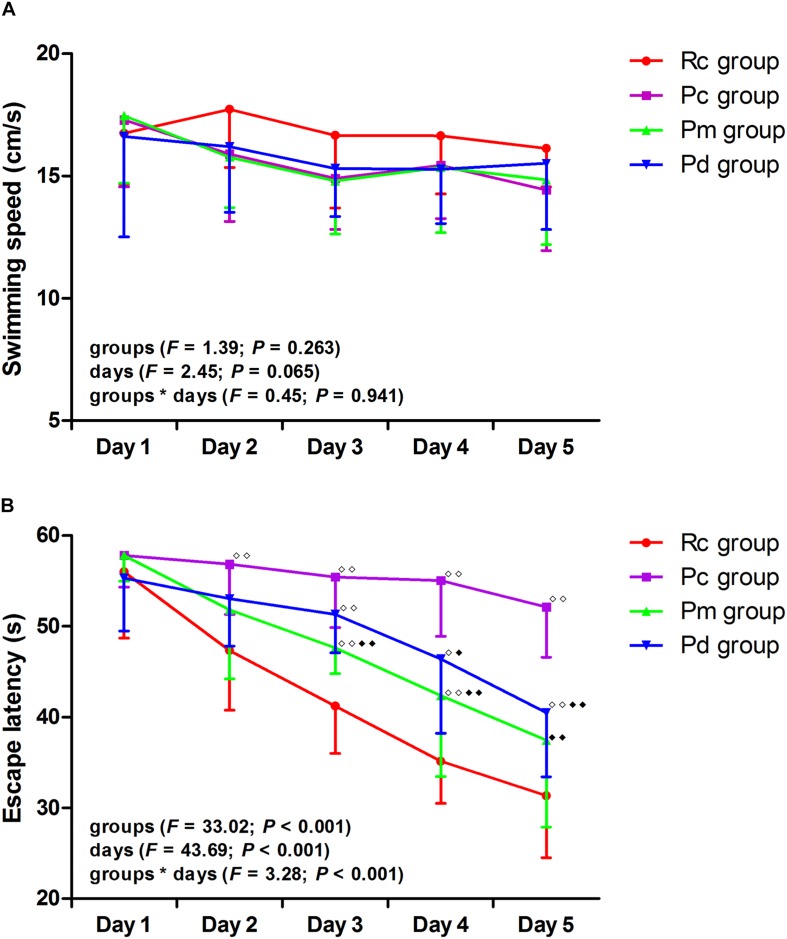
FIGURE 2.
Results of the hidden platform trial in each group (n = 10, mean ± SD). (A,B) Comparison between the swimming speed and escape latency of all groups. A two-way ANOVA with repeated measures was used. LSD-t was presented in Supplementary Table 1. ◆◆P < 0.01, ◆P < 0.05 compared with the Rc group. ◆◆P < 0.01, ◆P < 0.05 compared with the Pc group.

