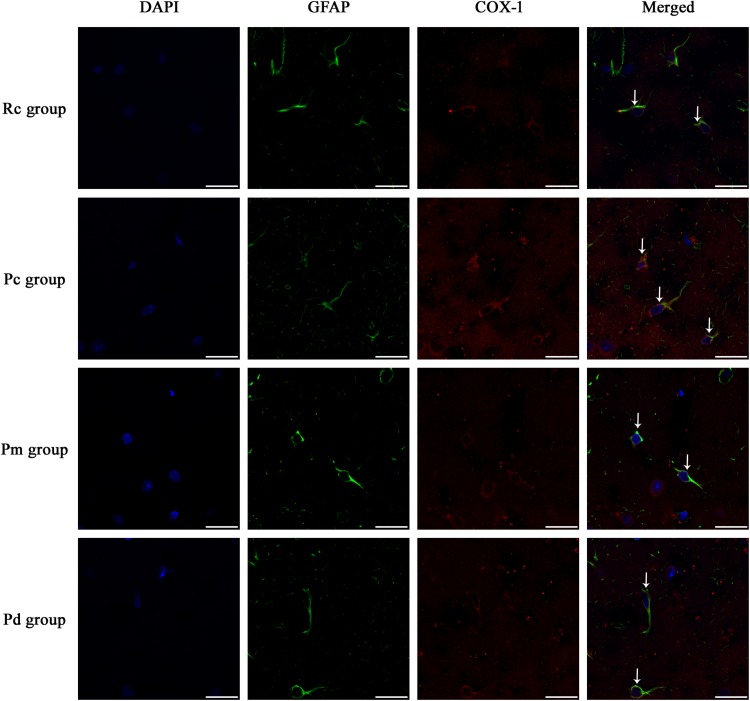
FIGURE 5.
Representative images of IF staining of GFAP (green) and co-expressed COX-1 (red) in each group. GFAP is labeled with green fluorescence and the coexpressed COX-1 with red fluorescence. The nucleus is labeled with blue fluorescence. The astrocytes showed a polygonal nucleus. In the hippocampus, the positively stained cells are shown with white arrows. Scale bar is 20 μm.

