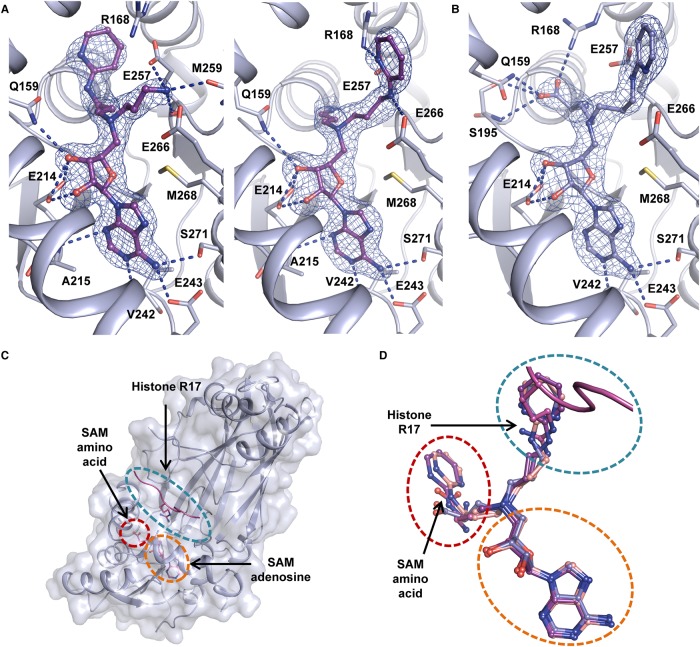
Figure 3. Crystal structures of inhibitors 9 and 10 in complex with CARM1.
(A) 2mFo-DFc electron density maps contoured at σ = 1 for two monomers within the asymmetric unit of the CARM1·9 complex structure. Polar contacts as computed by PyMol are indicated by blue dashed lines and residues involved in SAM and substrate arginine binding are shown in stick representation and are labelled; (B) 2mFo-DFc electron density map of inhibitor 10 contoured at σ = 1. Polar contacts and relevant residues are shown as for (A). All monomers within the asymmetric unit of the CARM1·10 structure have similar electron density for 10 corresponding to the same ligand conformation as depicted in (B). (C) binding pockets of adenosine (orange dashes) and SAM amino acid (red dashes), and substrate binding channel (teal dashes) generated using a CARM1·H3 tail peptide·sinefungin complex crystal structure (PDB code 5DX0) [48]. (D) Superposition of complex structures with ligands 8 (pale pink, two conformations observed are shown), 9 (purple, two conformations observed are shown) and 10 (blue, single conformation) with a structure of CARM1 in complex with histone 3 and sinefungin (magenta, PDB code 5DX0) [48].

