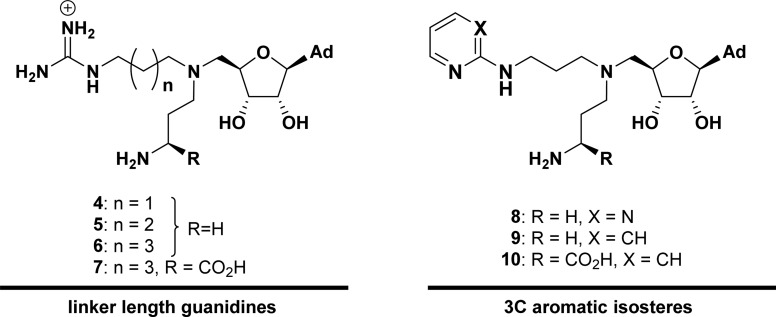
Table 1. Kd and IC50 values for series of inhibitors (4–10) and SAH against PRMT1 and CARM1 measured using ITC and enzyme activity assays, respectively.

| Inhibitor | Kd ± standard error (µM) | IC50 (95% confidence interval) (µM) | ||
|---|---|---|---|---|
| PRMT1 | CARM1 | PRMT1 | CARM1 | |
| 4 | 10.2 ± 0.996 | 3.32 ± 0.335 | 7.2 (3.5–15.0) | 2.3 (1.8–3.0) |
| 5 | 4.02 ± 0.453 | 7.18 ± 0.557 | 11.8 (9.0–15.5) | 8.7 (6.9–10.8) |
| 6 | 9.99 ± 1.89 | 9.80 ± 1.83 | 11.6 (4.9–27.2) | 17.7 (13.5–23.2) |
| 7 | 32.2 ± 3.531 | 38.1 ± 9.61 | 22.0 (14.4–33.5) | 24.1 (15.4–37.6) |
| 8 | 10.2 ± 4.21 | 2.30 ± 0.162 | 22.0 (15.7–30.8) | 0.7 (0.5–1.0) |
| 9 | 15.3 ± 1.57 | 1.14 ± 0.411 | 11.1 (5.6–21.8) | 0.3 (0.1–1.1) |
| 10 | 43.7 ± 14.92 | 1.11 ± 0.132 | 25.3 (17.3–37.0) | 0.8 (0.6–1.0) |
| SAH | 0.709 ± 0.057 | 0.775 ± 0.111 | 0.5 (0.2–1.0) | 0.2 (0.1–0.4) |
Stoichiometry fixed to 0.5.
This Kd is derived from a competition experiment with SAH as the Kd was not accessible through direct titration.
