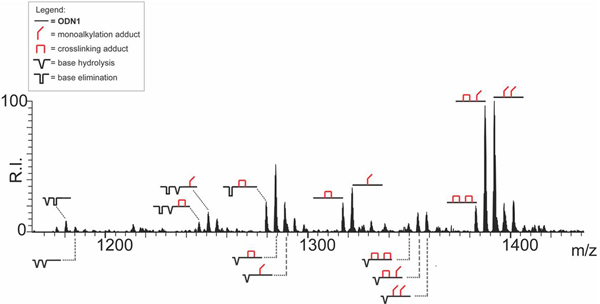
Figure 5.

ESI-MS spectrum of reaction mixture obtained by incubating 2 μM of oligodeoxynucleotide ODN1 with 50 μM of bis-3-chloropiperidine 1 at 37 °C for 2 h. The analysis was performed in 150 mM ammonium acetate (see Experimental for conditions). Lower intensity signals near free/bound species consist of typical sodium and ammonium adducts. The spectrum shows the concentration-dependent reactions induced by compound 1 on ODN1. Only the region containing the 4- charge state is shown. To facilitate the interpretation, we included in the spectrum the graphical representation of identified reaction products (see inset for symbols legend). The symbol  corresponds to unmodified oligodeoxynucleotide ODN1;
  mono-alkylation adduct in which the remaining 3-chloropiperidine function was hydrolyzed to a 3-hydroxyl;
  crosslinking adduct;
  base hydrolysis (modified G formally replaced by OH);
  base elimination (elimination of alkylated G nucleobase).
