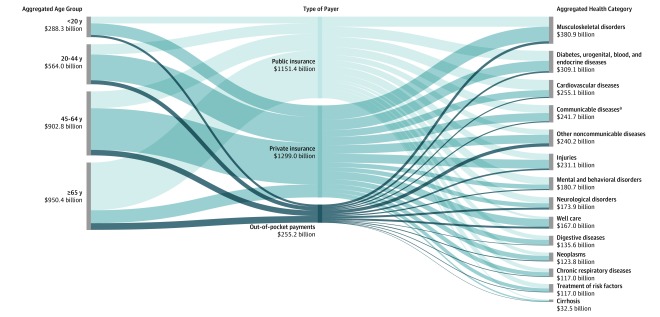
Figure 1. Estimated Health Care Spending by Aggregated Age Group, Type of Payer, and Aggregated Health Category in 2016.
Reported in 2016 US dollars. Each of the 3 columns sums to the estimated $2.7 trillion of 2016 spending disaggregated in this study. The width of each line reflects the relative share of the estimated $2.7 trillion attributed to that age group, type of payer, or aggregated health category. Table 2 and Table 3 list the aggregated health category to which each health condition was classified.
aIncludes maternal, neonatal, and nutritional disorders.

