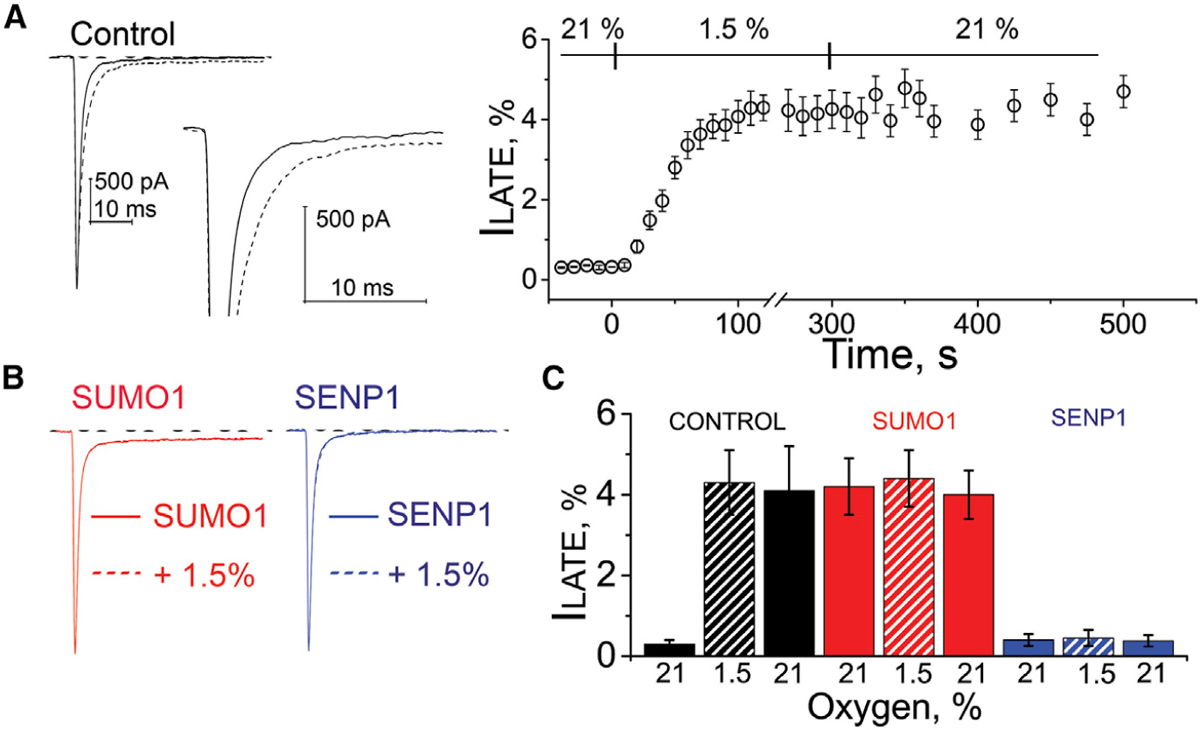
Figure 1. Acute Hypoxia and SUMO1 Augment the ILATE in Human iPS-CMs.

INa in human iPS-CMs was studied by whole-cell patch clamp. ILATE was measured at −30 mV and is shown as a mean percentage of the peak current remaining between 50 and 100 ms after the peak current. Hypoxia challenge was a drop in O2 from 21% to 1.5%. The O2 level was measured in real time in the recording chamber and fell from 21% to 1.5% O2 in 11 ± 3 s (not shown). The time course of hypoxic modulation of INa was studied by steps from −100 mV to −30 mV every 10 s. Whole-cell currents were not studied for more than 600 s to maintain consistent voltage clamp control of INa. Cells were studied with control solution (black), 1 nM SUMO1 (red), or 1 nM SENP1 (blue) in the recording pipette. Data are mean ± SEM for 8 to 10 cells per group. Measured values and statistical analyses are listed in Table 1.
(A) Left: example traces showing ILATE at −30 mV increased when control perfusate at 21% O2 (black) was exchanged with a hypoxic solution at 1.5% O2 (black dash). Inset: the increase in ILATE shown in response to hypoxia. Right: the time course for changes in ILATE in response to hypoxia and on return to normoxia (21%). Scale bars represent 500 pA and 10 ms.
(B) Left: SUMO1 in the pipette (red) increased ILATE. No further change in ILATE was observed when the control perfusate was exchanged with a hypoxic solution at 1.5% O2 (red dash). Right: ILATE was not observed with SENP1 in the pipette when cells were studied at 21% (blue) or 1.5% O2 (blue dash). In each case, the dashed lines overlap with the solid lines.
(C) A histogram showing the mean ILATE as a percentage of the peak current from cells studied at 21% O2 (solid color) after 200 s at 1.5% O2 (hatched color) and after 200 s following a return to 21% O2 (solid color) with control solution (black), 1 nM SUMO1 (red), or 1 nM SENP1 (blue) in the recording pipette.
