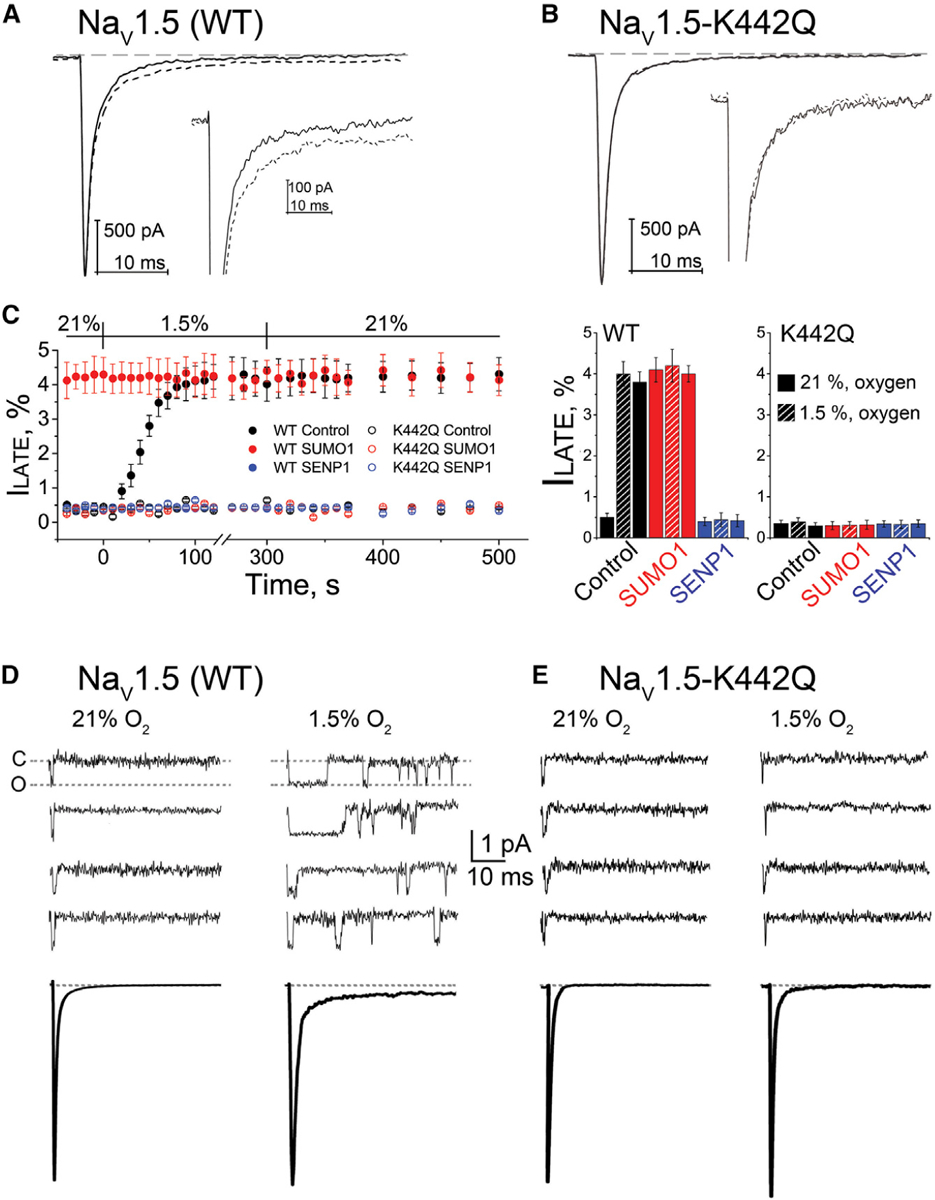
Figure 3. K442 Is Required for Hypoxia and SUMO1-Mediated ILATE.

Human NaV1.5 wild-type (WT) or NaV1.5-K442Q was expressed in CHO-K1 cells with NaVβ1 and studied under normoxic (21%) and hypoxic (1.5%) O2 conditions with control solution (black), 1 nM SUMO1 (red), or 1 nM SENP1 (blue) in the recording pipette, as indicated. The late current (ILATE) was studied at −30 mV and is shown as a mean percentage of the peak current remaining between 50 and 100 ms after the peak current. The time course of hypoxic modulation of INa was studied by steps from −100 mV to −30 mV every 10 s. Data are mean ± SEM for 8 to 12 cells per group. Single-channel currents were studied in cell-attached mode and elicited every 5 s by a 50-ms depolarizing pulse to −30 mV from a holding potential of −120 mV. Data were recorded at filter and sampling frequencies of 5 and 50 kHz, respectively, and processed offline using a 1.2-kHz Bessel filter for display. Recording pipettes were filled with extracellular buffer. For each cell, null sweeps (with no channel activity) were identified, averaged offline, and subtracted from the data sweeps before analysis.
(A) Example traces from a cell expressing WT NaV1.5 channel activation at −30 mV; ILATE increased when control perfusate at 21% O2 (black) was exchanged with a hypoxic solution at 1.5% O2 (black dash). Inset: the increase in ILATE shown in response to hypoxia.
(B) Example traces showing that hypoxia does not induce an increase in ILATE in cells expressing NaV1.5-K442Q channels.
(C) Left: the time course for changes in ILATE in response to hypoxia and on return to normoxia for cells expressing WT NaV1.5 (closed circles) or NaV1.5-K442Q channels (open circles) with control solution (black), SUMO1 (red), or SENP1 (blue) in the recording pipette. Right: a histogram showing the mean ILATE as a percentage of the peak current from cells studied at 21% O2, after 200 s at 1.5% O2 and after 200 s following a return to 21% O2, with the pipette solutions indicated.
(D) Top: upon depolarization, single NaV1.5 channels opened, inactivated rapidly, and did not reopen. NaV1.5 channels reopened upon exposure to 1.5% O2. Null traces in normoxia and hypoxia were 55% ± 5% (n = 20 patches; 2,000 sweeps) and 53% ± 4% (n = 20 patches; 2,000 sweeps), respectively. Bottom: ensemble average traces (n = 200–220 sweeps) for the condition indicated.
(E) Top: single NaV1.5-K442Q channels did not reopen in ambient or hypoxic conditions. Null traces were 51% ± 3% (n = 20 patches; 2,000 sweeps) and 50% ± 2% (n = 20 patches; 2,000 sweeps), respectively. Bottom: ensemble average traces (n = 200–225 sweeps) for the condition indicated.
