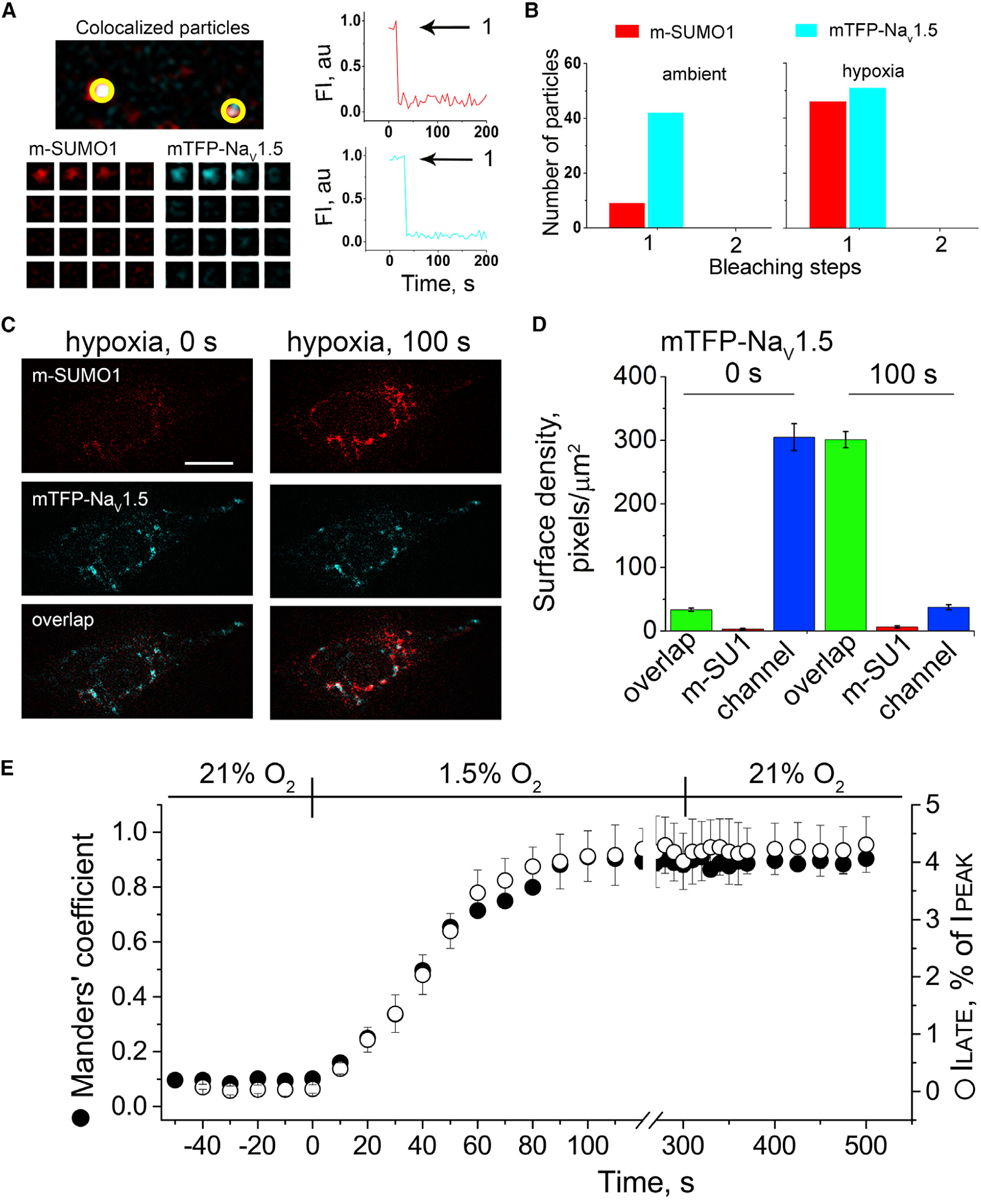
Figure 4. Hypoxia Recruits One SUMO1 Monomer to Each Cell Surface NaV1.5 Channel.

Single mTFP-NaV1.5 channels (blue) and SUMO1 tagged with mCherry (m-SUMO1, red) were studied in CHO-K1 cells by TIRFM. Stoichiometric (photobleaching) and pixel-by-pixel analysis for subunit density and co-localization were performed as described in the STAR Methods. Manders’ coefficients were assessed post hoc for 3–5 regions per cell, and co-localization was defined as the presence of both fluorophores at more than 30% of the maximum fluorescence level recorded in that stack (and their overlap is represented in the images as white pixels). The time course of hypoxic modulation of NaV1.5 ILATE was studied with steps from −100 mV to −30 mV every 10 s and normalized to the peak current. Data represent 5–8 cells, and biophysical parameters and single particle statistical analyses are summarized in Tables S1 and S3.
(A) Left: single co-localized particles with mCherry and TFP fluorescence were observed at the surface of cells expressing NaV1.5 and SUMO1. The time courses for simultaneous photobleaching of the fluorophores revealed that complexes have one subunit of each type.
(B) Histogram of photobleaching steps showing that hypoxia increased single m-SUMO1 (red) subunits at the cell surface co-localized with mTFP-NaV1.5 channels (blue), without a change in subunit stoichiometry.
(C) Left: the images show that in ambient O2, the surface density of m-SUMO1 (top) is low compared to NaV1.5 (middle) with little co-localization (bottom). Right: hypoxia recruits m-SUMO1 to the cell surface within ~100 s (top), where it is co-localized with NaV1.5 channels (bottom); surface levels of NaV1.5 were not observed to change (middle). The scale bar represents 10 μm.
(D) Histogram of surface density summarizing six cells studied as described in (A). In ambient O2, the density of pixels per μm2 with SUMO1 alone (red) was 3 ± 1, and 305 ± 21 for NaV1.5 (blue). The density of pixels with both fluorophores (green) was 33 ± 3 per μm2. Hypoxia increased co-localization to 301 ± 13 pixels per μm2 and decreased the density of free NaV1.5 channels (37 ± 4) without altering the density of free SUMO1 (6 ± 2).
(E) The time course for the hypoxia-induced increase in the co-localization of mTFP-NaV1.5 and m-SUMO1 (Manders’ coefficient, black circle) and the magnitude of ILATE, as a percentage of the peak current (open circle) were coincident. A mean Manders’ coefficient of 0.10 ± 0.01 measured in ambient O2 increased to 0.91 ± 0.03 in ~100 s of exposure to hypoxia. The mean ILATE rose from 0.46% ± 0.1% to 4.4% ± 0.8%. Increases in the Manders’ coefficient and late current versus peak current ratio were unchanged for at least 3 min after cells were restored to ambient O2.
