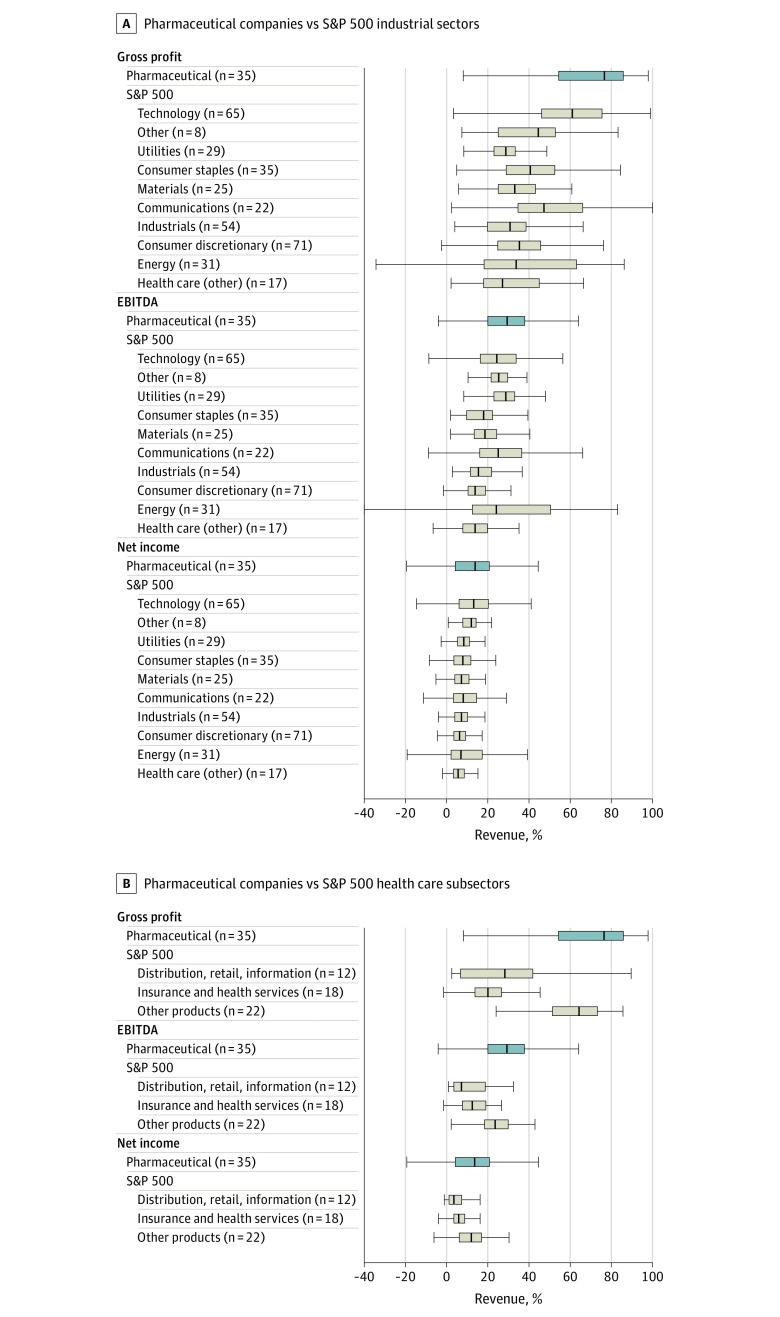
Figure 2. Annual Profit Margins of Pharmaceutical Companies Compared With Other Industrial Sectors.
Box plot lines represent the 25th percentile, median, and 75th percentile. Whiskers are 1.5 times the interquartile ranges. Financial terms are defined in the Box. Annual profit margins are expressed as a percentage of annual revenue. A, Comparison of pharmaceutical companies with 10 industrial sectors in the S&P 500 data set. B, Comparison of pharmaceutical companies with 3 other subsectors of the health care data set. EBITDA indicates earnings before interest, taxes, depreciation, and amortization.

