
Figure 1:
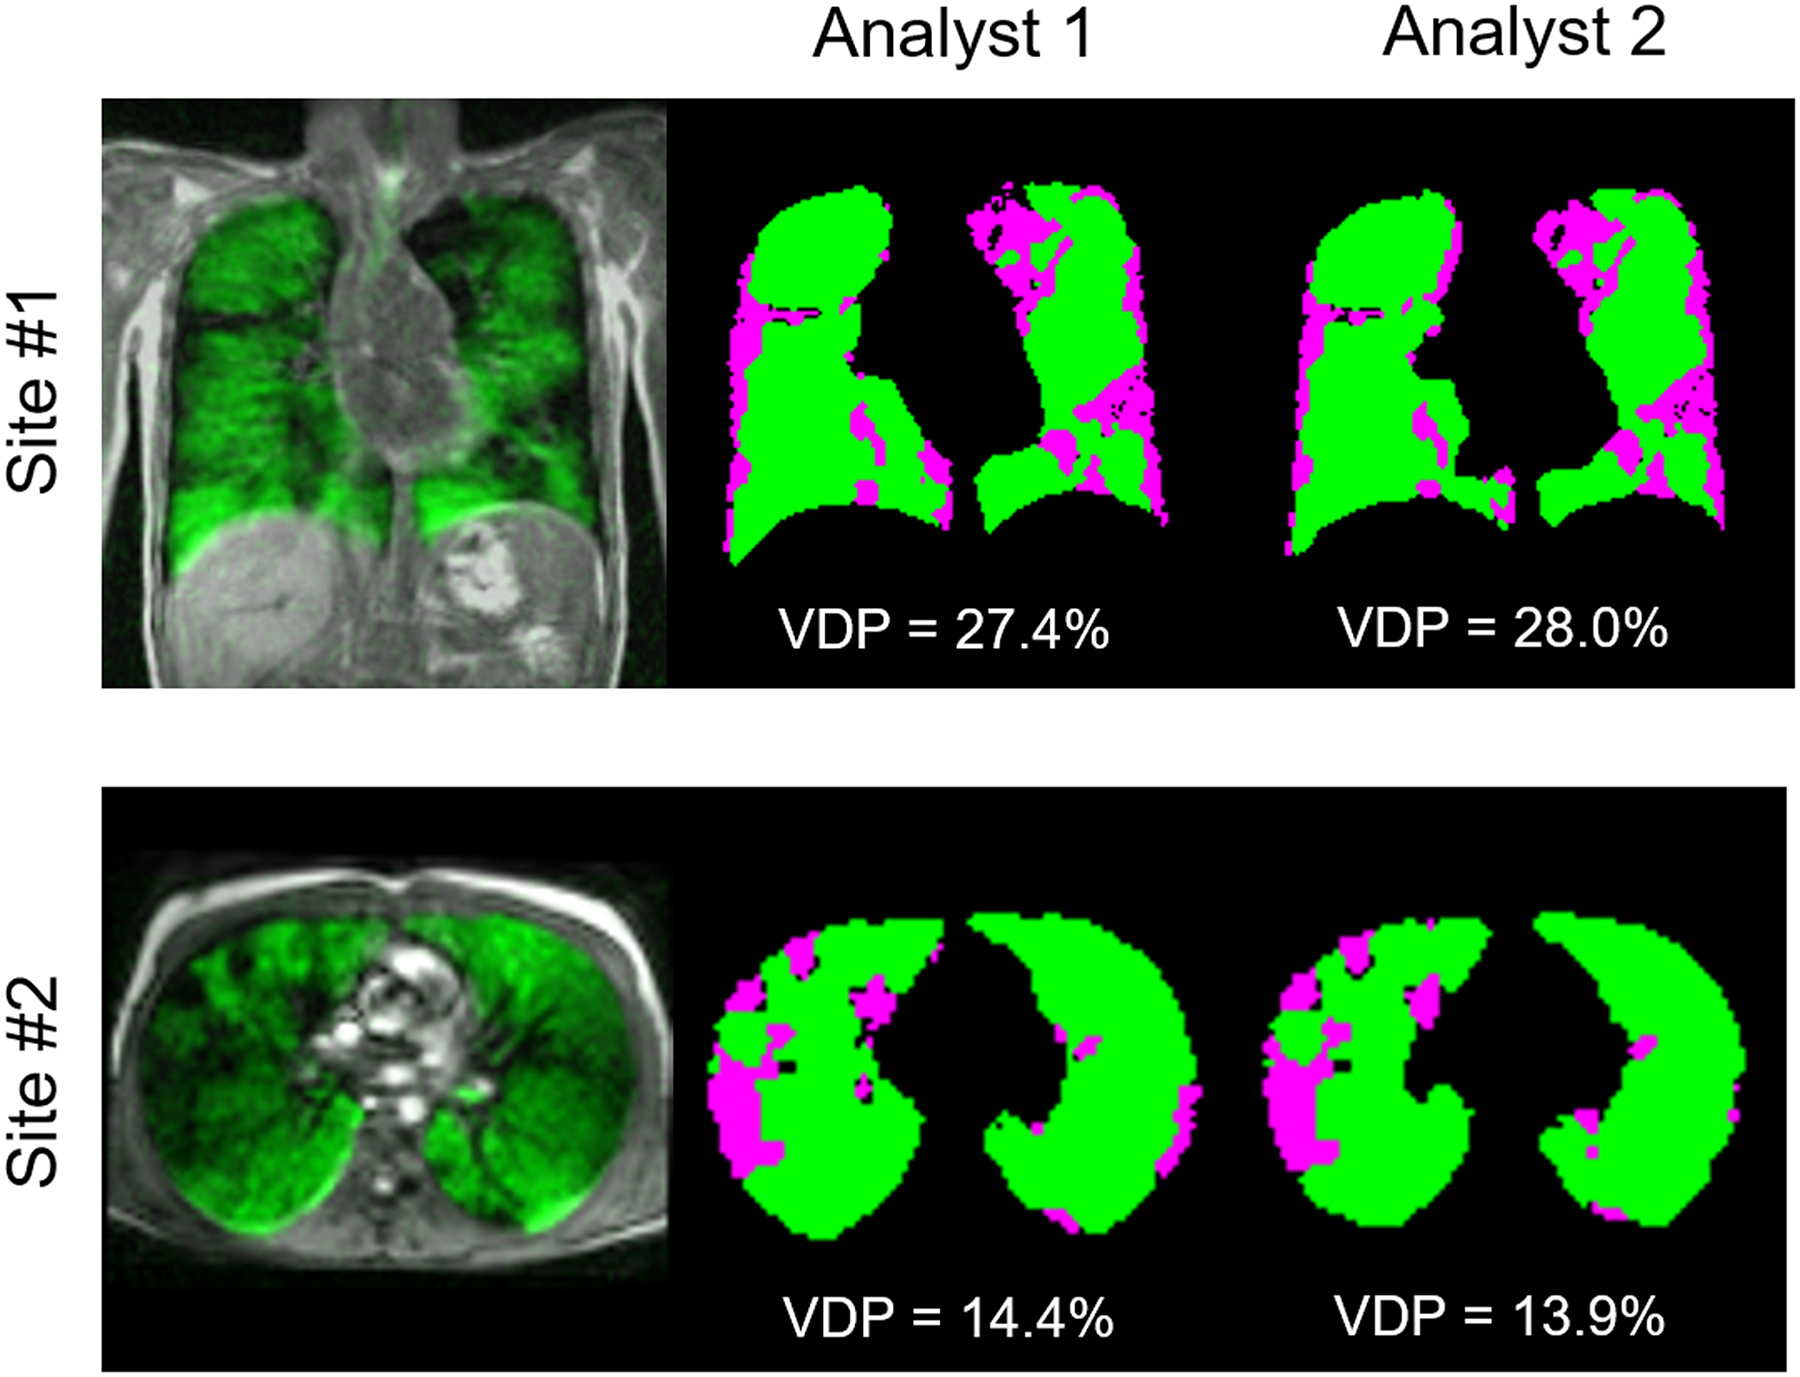
Comparison of segmented ventilation and defect maps obtained from two representative CF patients at Site #1 (top) and Site #2 (bottom). The leftmost images show an overlay of the center slice HP 129Xe image in green, with the 1H image in greyscale. VDP results and segmented maps are shown for both trained analysts, where ventilated areas are shown in green and defect areas are shown in purple.