
Figure 2:
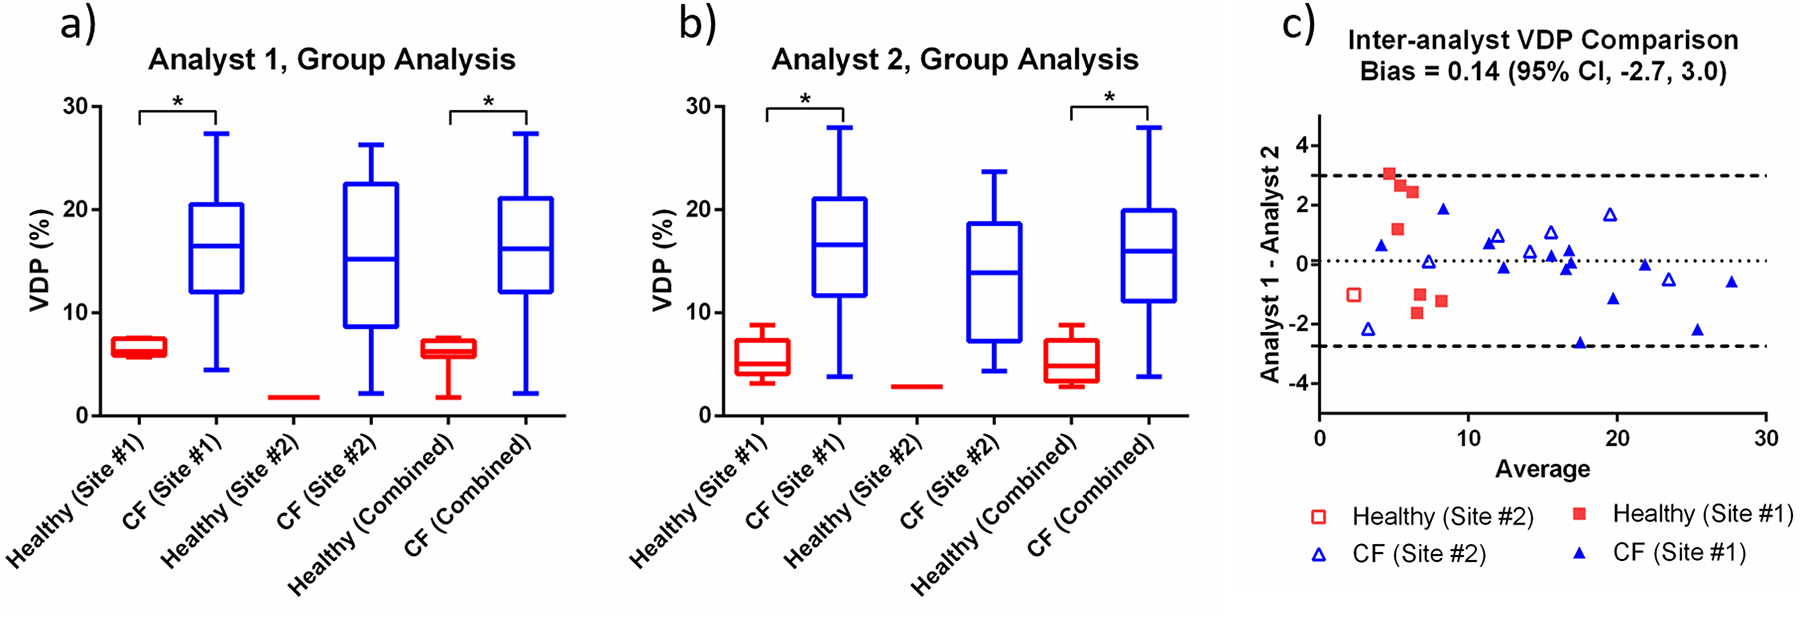
Box and whisker plots showing the VDP measured by (a) Analyst 1 and (b) Analyst 2 for healthy and CF cohorts. VDP results are shown separately for each institution and also as a combined cohort. (c) Bland-Altman analysis showing the inter-analyst agreement for all VDP measurements in the combined dataset.