Figure 6.
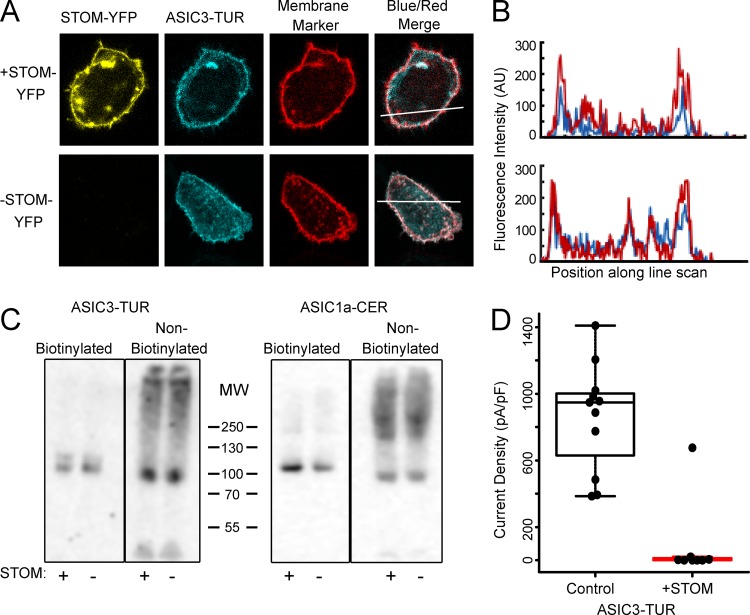
STOM does not alter ASIC3 expression on the plasma membrane. (A) Confocal images of cells expressed with ASIC3-TUR, membrane marker (TagRFP-labeled I-II loop of Cav1.2 with Cav1.1 N-terminus), with (top) and without STOM-YFP (bottom). The displayed images are 30 x 36 μm. (B) Line scan of the blue and red signals from A (indicated by the bar) shows that ASIC3-TUR peak intensity overlaps with membrane marker on the plasma membrane in the presence and absence of STOM-YFP. This experiment was repeated for an n = 10. (C) Western blot against the fluorescent tag of ASIC3-TUR and ASIC1a-CER with and without STOM after performance of a cell surface biotinylation assay. (D) Boxplot showing the current density measured from pH 5.5–evoked currents from ASIC3-TUR with and without STOM. Current density for control and +STOM were 859.2 ± 94.1 pA/pF (n = 11) and 4.6 ± 2.7 pA/pF (n = 7), respectively. Data are given as mean ± SEM.

