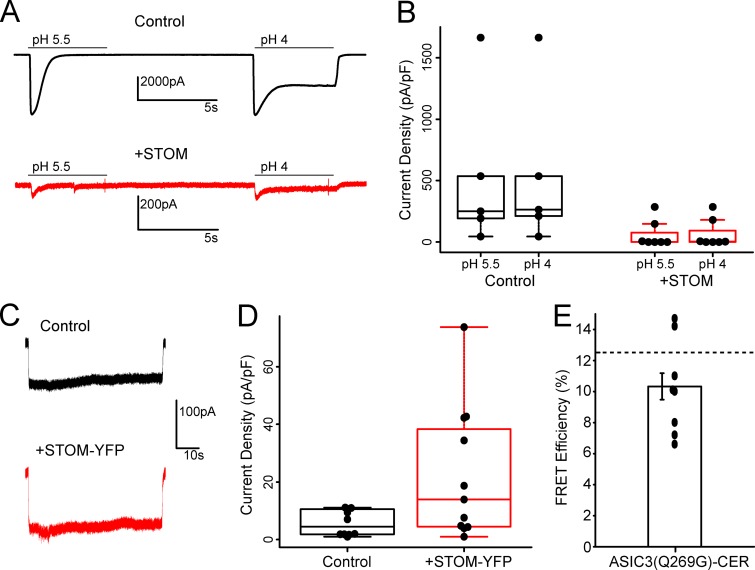
Figure 7.
Potential mechanism for STOM-dependent regulation of ASIC3. (A) Currents from ASIC3 with and without STOM coexpression. Currents were measured first with a switch to pH 5.5 for 5 s followed by a 9-s recovery period at pH 8.0. Then currents were measured with a switch to pH 4.0 for 5 s. (B) Boxplot showing the current density measured from pH 5.5– and pH 4.0–evoked currents from ASIC3 with and without STOM. Current densities for control at pH 5.5 and pH 4.0 were 538.0 ± 261.7 pA/pF (n = 5) and 544.5 ± 260.2 pA/pF (n = 5), respectively. Current densities for the +STOM case at pH 5.5 and pH 4.0 were 63.4 ± 39.4 pA/pF (n = 7) and 68.1 ± 41.0 pA/pF (n = 7), respectively. (C) Representative pH 5.0–evoked currents from the ASIC3(Q269G)-CER mutant alone (black) and cotransfected with STOM (red). (D) Boxplot of the current density of the ASIC3(Q269G)-CER channel with and without STOM coexpression. Average current densities for ASIC3(Q269G)-CER in the absence (black) and presence (red) of STOM were 5.7 ± 1.3 pA/pF (n = 10) and 22.5 ± 6.6 pA/pF (n = 11), respectively. (E) Plot of the FRET efficiency between ASIC3(Q269G)-CER and STOM-YFP. Average FRET efficiency of ASIC3(Q269G)-CER + STOM-YFP = 10.3 ± 0.85% (n = 10). Dotted line in FRET plots corresponds to control WT ASIC3-CER/STOM-YFP FRET signal replotted from Fig. 1 E for comparison. Data are given as mean ± SEM.

