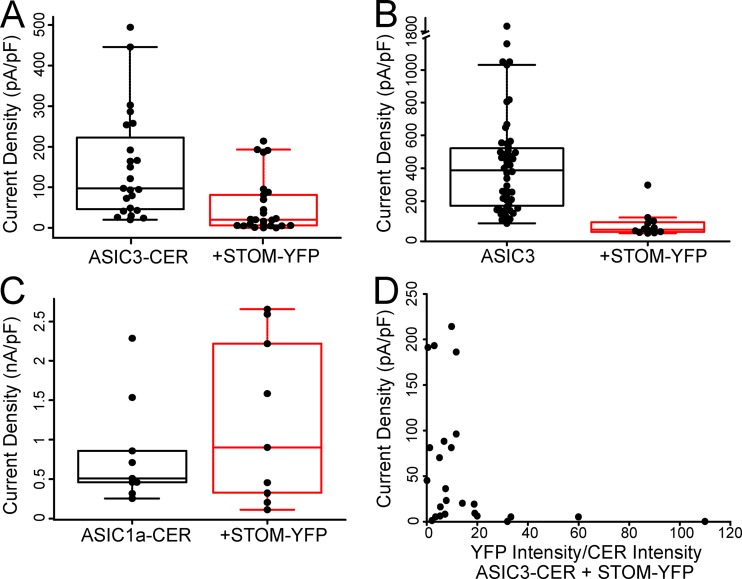
Figure S1.
Data examining the effect of fluorescent tags on the regulation of ASIC3 by STOM. (A) Boxplots showing the current density measurements for ASIC3-CER with and without STOM-YFP. Average current densities of ASIC3-CER in the absence (black) and presence (red) of STOM-YFP were 137.0 ± 23.5 pA/pF (n = 22) and 47.1 ± 12.4 pA/pF (n = 24), respectively. (B) Current densities of the untagged ASIC3 in the absence (black; replotted from Fig. 1 B) and presence of STOM-YFP. Average current densities were 364.0 ± 32.6 pA/pF (n = 45) and 34.3 ± 9.1 pA/pF (n = 11), respectively. (C) Boxplots showing average current densities of ASIC1a in the absence (black) and presence (red) of STOM-YFP, which were 509.7 ± 74.2 pA/pF (n = 7) and 1,227.5 ± 329.8 pA/pF (n = 9), respectively. (D) Current densities of ASIC3-CER with STOM-YFP from Fig. 3 C plotted as a function of the ratio of fluorescence intensity of YFP/CER. These data show that after about a 15:1 ratio of YFP/CER, the magnitude of the regulation of ASIC3-CER was as large as in the untagged STOM case. Data are given as mean ± SEM.

