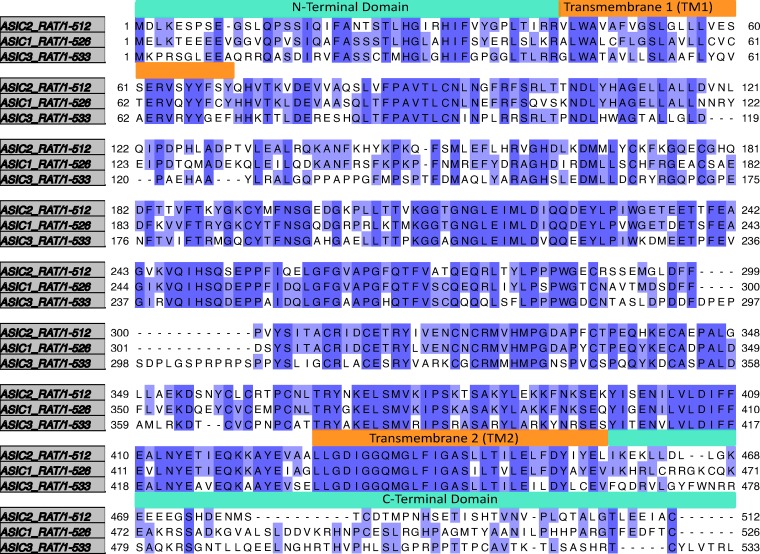
Figure S2.
Sequence alignment of rat ASIC3, rat ASIC1a, and rat ASIC2a. Sequence alignment generated in Jalview v.2.10.5 using Mafft under default settings. Dark purple regions show residues that are identical between the three proteins. Light purple shows residues that are identical in two of the proteins. Orange boxes are present above the residues that make up the transmembrane domains. Cyan boxes are present above the residues that comprise the N- and C-terminus.

