
Figure 2.
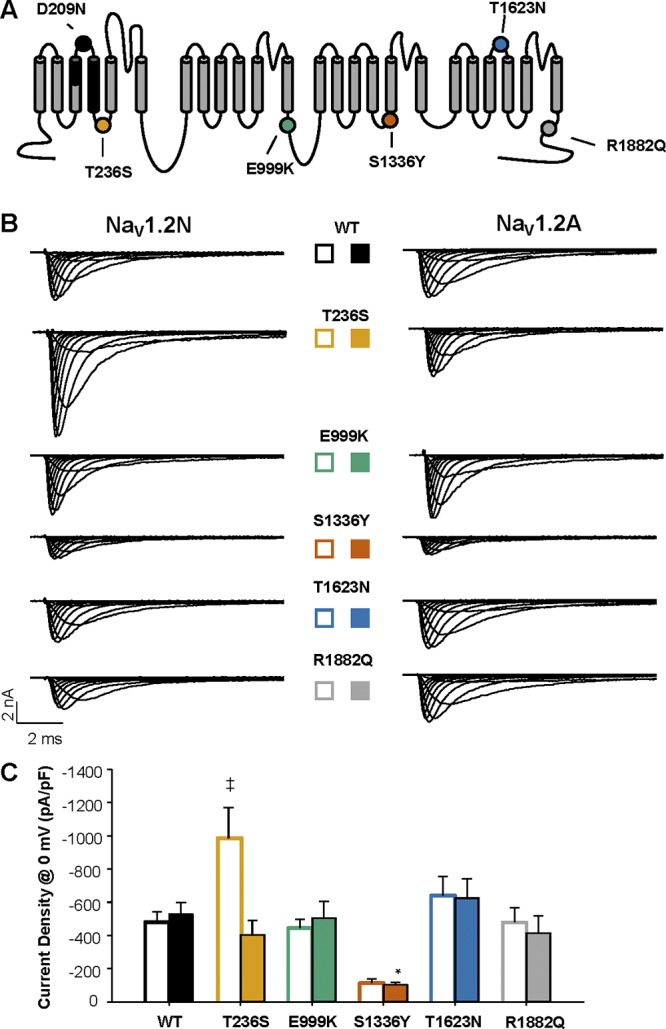
Function of EOEE-associated variants. (A) Predicted transmembrane topology of NaV1.2, highlighting the location of the exon 5 coding region (black shaded), amino acid change associated with alternative exon splicing (black dot), and EOEE-associated variants (colored dots). (B) Whole-cell sodium currents of EOEE-associated NaV1.2 variants in either the adult (NaV1.2N; left) or neonatal (NaV1.2A; right) splice isoforms. (C) Peak current density elicited by test pulses to 0 mV from a holding potential of −120 mV for NaV1.2N (open bars) and NaV1.2A (closed bars) proteoforms. All data are expressed as mean ± SEM for 8–15 measurements. *, P < 0.05 compared with NaV1.2A; ‡, P < 0.05 NaV1.2N. EOEE-associated variants were compared with WT NaV1.2 of the same proteoform using a one-way ANOVA, followed by Dunnett’s post hoc test.