Figure 5.

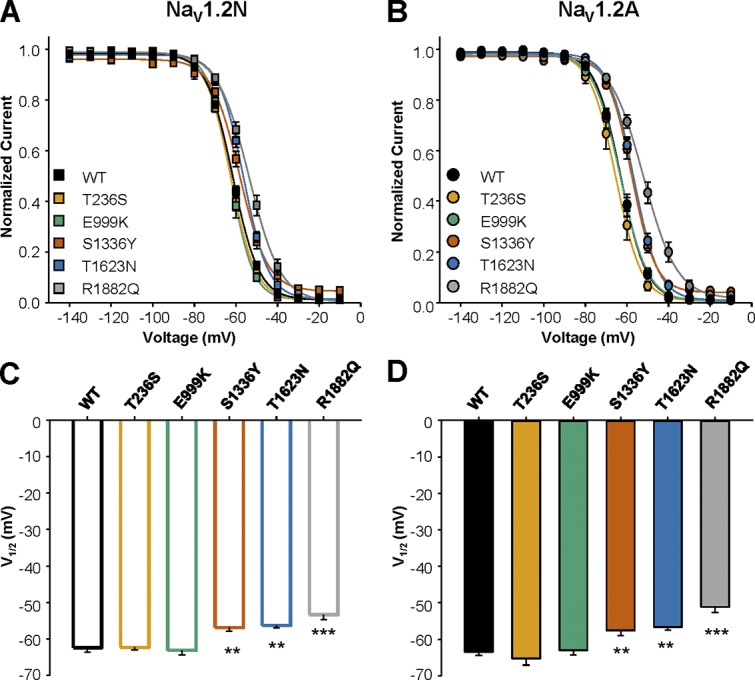
Voltage dependence of inactivation of EOEE-associated NaV1.2 variants. (A and B) Voltage dependence of inactivation for WT and EOEE-associated NaV1.2 variants in the neonatal (A) or adult (B) proteoform. (C and D) Values for V1/2 of inactivation for WT and EOEE-associated NaV1.2 variants in the neonatal (C) or adult (D) proteoform. All data are expressed as mean ± SEM for 8–15 measurements. EOEE-associated variants were compared with WT NaV1.2 of the same proteoform using one-way ANOVA, followed by Dunnett’s post hoc test. ***, P < 0.0001; **, P < 0.01.
