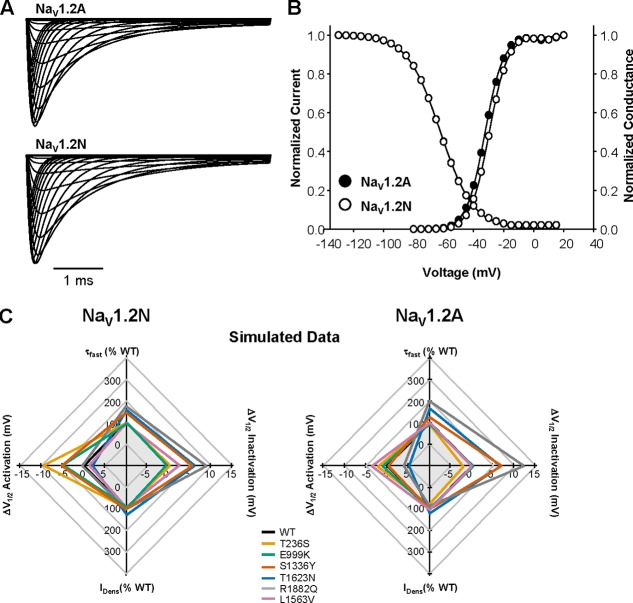
Figure 8.
Computational modeling of WT NaV1.2 splice isoforms. (A) Simulated whole-cell sodium current for NaV1.2A (top) and NaV1.2N (bottom). (B) Voltage dependence of activation and inactivation for simulated sodium currents mediated by the NaV1.2N (open circles) and NaV1.2A (closed circles). Curves for voltage dependence of inactivation for both isoforms are superimposed. (C) Radar plots comparing changes in biophysical parameters of whole-cell sodium current from simulated data for NaV1.2N (left) and NaV1.2A (right).

