Figure 1.
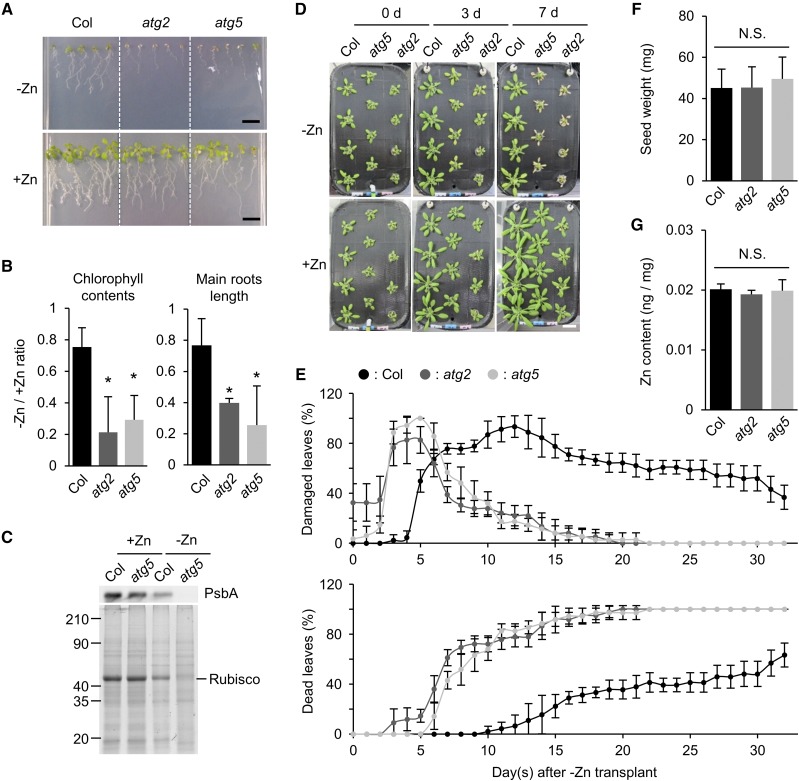
Autophagy-defective plants exhibit accelerated −Zn symptoms. A, Phenotypes of Col, atg2, and atg5 plants on solid media, grown vertically for 14 d after sowing under long-day conditions. −Zn: Zn deficiency (0 μm); +Zn: normal media containing a sufficient amount of Zn (1 μm). Scale bars = 1 cm. B, Values of −Zn/+Zn ratios of chlorophyll concentration (left) and main root length (right) shown in (A). n = 3, *P < 0.05 Student’s t test, error bars show sd. C, Protein levels in Col and atg5 plants under +Zn and −Zn conditions. PsbA was detected by western blot. Total proteins were separated by SDS-PAGE and stained with Coomassie Brilliant Blue (CBB). Approximate molecular mass (kilodalton) is displayed on the left. Equal amount of total protein was loaded in each lane. D, Phenotypes of Col, atg5, and atg2 plants in hydroponic transplant experiments. Twenty-one days after sowing on +Zn media, plants were transplanted to −Zn or +Zn media. Images were acquired at 0, 3, and 7 DAT. Scale bar = 2 cm. E, Quantified data of (D). Percentages of damaged (chlorotic) leaves (upper) and dead (completely dried) leaves (lower) in a time-course manner. n = 4. Error bars show sd. F, Seed weight of Col, atg2, and atg5 plants. Seeds were harvested from soil-grown plants and 500 seeds were counted and weighted. Individual seed weight was calculated by dividing the total weight by 500. n = 4. Error bars show sd. No significant difference was detected among the three samples in Student’s t test (P > 0.05). G, Zn contents per 1 mg of seeds of Col, atg2, and atg5 plants. Quantification was performed by ICP-MS. n = 4. Error bars show sd. No significant difference was detected among the three samples in Student’s t test (P > 0.05). N.S., not significant.

