Figure 5.
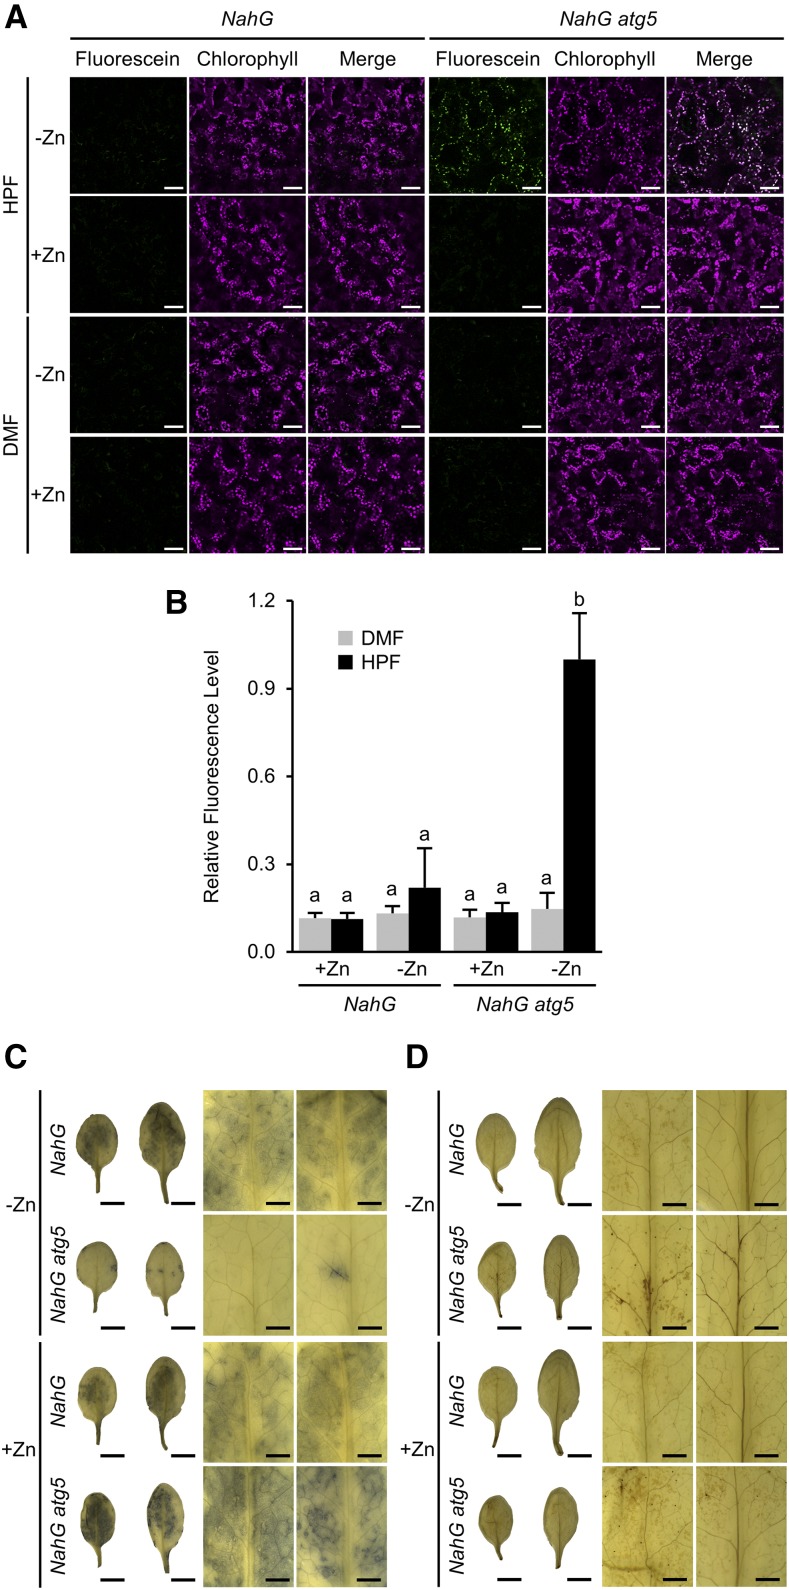
Changes of ROS under −Zn in autophagy-defective plants. A, Detection of ·OH was performed using HPF. Fluorescence of fluorescein, generated from HPF by reaction with ·OH, is shown in green; autofluorescence of chlorophylls is shown in magenta. Merged images are shown in the right representations. Fluorescein fluorescence was increased in NahG atg5 plants at 3 DAT (from +Zn to −Zn), and was colocalized with chloroplasts. DMF, the solvent for HPF, was used as the negative control. Scale bars = 50 μm. B, Quantified data from (A). Relative intensity of green fluorescence was measured using the software ImageJ. Columns with the same letter are not significantly different (P < 0.01, Student’s t test). n = 4. Error bars show sd. C and D, Results of NBT (C) and DAB (D) staining of NahG and NahG atg5 leaves at 3 DAT under −/+Zn. Left show whole leaves digitally extracted from the images taken by stereo microscope and shown on a white background. Right shows higher magnifications of the left. For each magnification, the left column shows the lower leaves, and the right column shows the upper leaves. Scale bars = 5 mm (left, showing whole leaves) and 1 mm (right).

