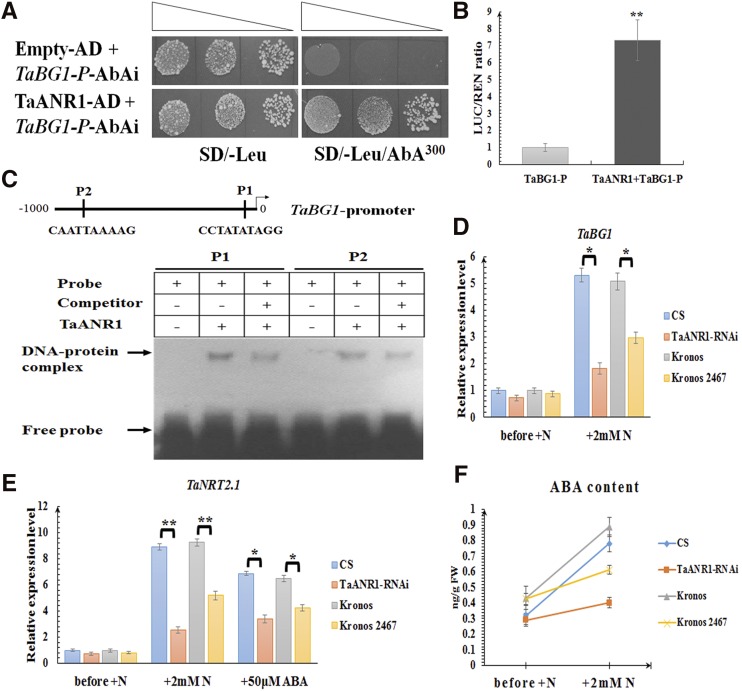
Figure 4.
The involvement of TaANR1 in nitrate-inducible ABA accumulation. A, Y1H assay showing that TaANR1 can bind to the promoter of TaBG1. SD/−Leu, SD medium without Leu; SD/−Leu/AbA300, SD medium without Leu supplemented with AbA at the concentration of 300 ng mL−1; P, promoter. Transformed yeast cells were dotted at 10−1 dilutions on the selective medium. B, Transient expression assay showing that TaANR1 can activate the expression of TaBG1. The gray column represents the relative LUC/REN ratio of the reporter in the presence of the empty effector (pBI221 empty vector) without TaANR1; and the black column represents the relative LUC/REN ratio of the reporter in the presence of the effector containing TaANR1. C, EMSA showing the relative binding affinity of TaANR1 to different CArG motifs harbored by the promoter of TaBG1. + and − indicate the presence and absence of the indicated probe or protein, respectively. P1, Probe 1; P2, probe 2. D, The expression levels of TaBG1 and (E) TaNRT2.1 in wild-type wheat lines, and the RNA interference (RNAi) and mutant (Kronos 2467) lines of TaANR1 under different conditions. The relative transcript abundance of every gene prior to adding nitrate was calculated and given the value 1. Columns marked with asterisks indicate significant differences (*P < 0.05; **P < 0.01) using Student’s t test. F, ABA levels in wild-type wheat lines, and the RNAi and mutant (Kronos 2467) lines of TaANR1 under different conditions. N, Nitrate. Each bar represents the mean ± sd of at least three biological replicates.

