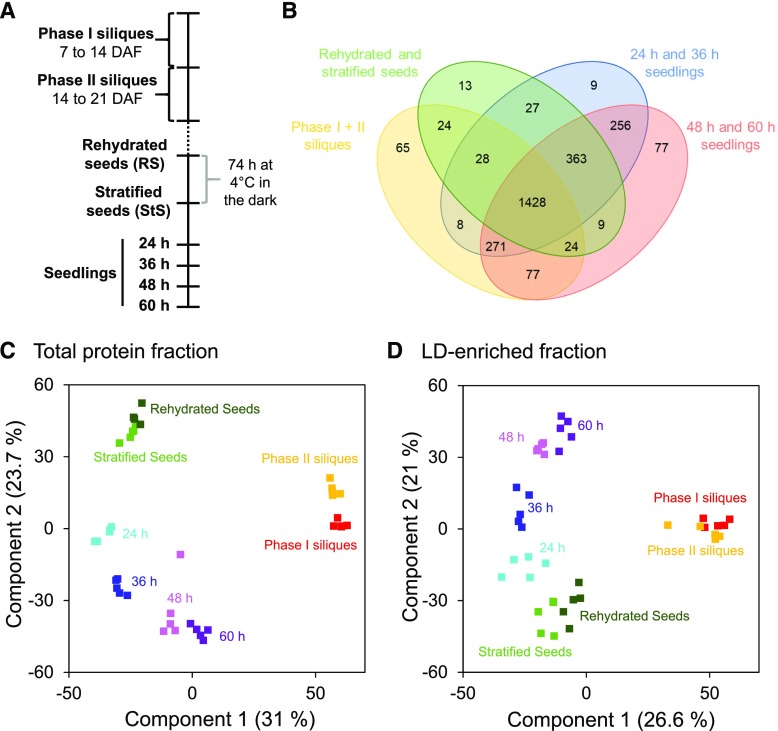
Figure 1.
Graphical representation of proteomic data derived from Arabidopsis siliques, seeds, and seedlings. A, Tissues were collected from two developmental stages of silique development (phase I, 7–14 DAF; phase II, 14–21 DAF) and six stages of seed germination and seedling establishment (rehydrated seeds, stratified seeds, and seedlings from 24 to 60 h of growth). B, Venn diagram of the distribution of all detected proteins from each of the different developmental stages examined. Proteins identified with at least two peptides using the iBAQ algorithm were grouped into four groups, as depicted. Common proteins were identified via InteractiVenn (Heberle et al., 2015). C and D, PCA was performed to compare the distribution of the five biological replicates at each developmental stage for both the total protein and LD-enriched fractions. Numbers in brackets give the percentage of the total variance represented by Components 1 and 2, respectively.

