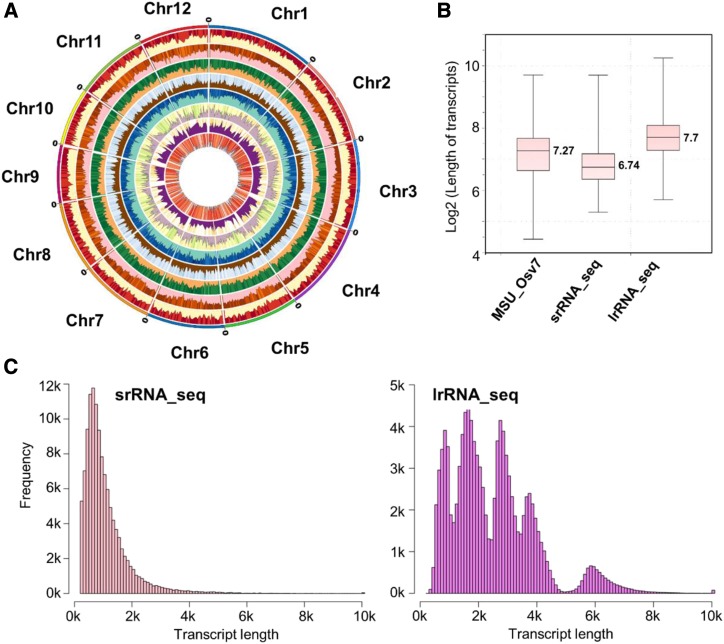
Figure 2.
Comparison of transcript properties between srRNA_seq and lrRNA_seq. A, Circos diagram of specialized transcripts identified by srRNA_seq and lrRNA_seq. 1, Total transcripts identified by srRNA_seq; 2, total transcript identified by lrRNA_seq; 3, intergenic transcripts identified by srRNA_seq; 4, intergenic transcripts identified by lrRNA_seq; 5, NATs identified by srRNA_seq; 6, NATs identified by lrRNA_seq; 7, fusion transcripts identified by srRNA_seq; 8, fusion transcripts identified by lrRNA_seq. B, Box plot of transcript lengths summarized in the three data sets using MSU_Osv7 annotation, srRNA_seq, and lrRNA_seq. C and D, Histogram plots showing the frequency of transcript lengths between srRNA_seq (C) and lrRNA_seq (D).

