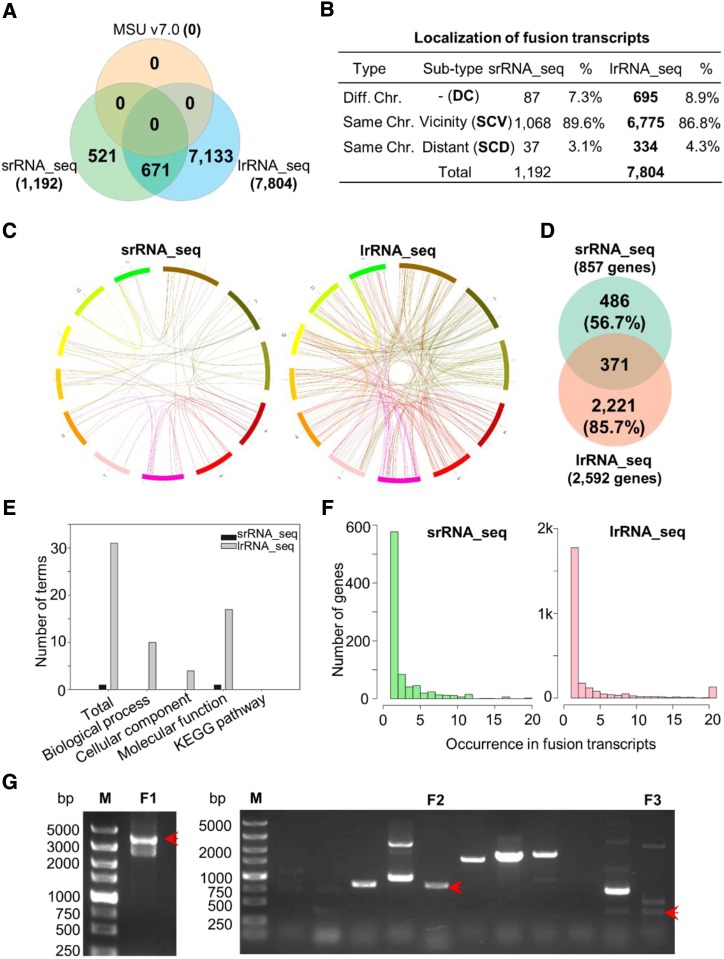
Figure 3.
Comparative analysis of fusion transcripts. A, Venn diagram showing the overlapping and unique fusion transcripts identified by srRNA_seq and lrRNA_seq. B, Summary of fusion transcript subtypes. C, Circos representations of fusion transcripts consisting of two genes. D, Venn diagram presenting the overlapping and unique genes involved in fusion transcript formation. E, GO and Kyoto Encyclopedia of Genes and Genomes (KEGG) enrichment analyses of fusion genes. F, Loci frequency present in fusion transcripts. G, RT-qPCR validation of fusion transcripts. Red arrows indicate the validated fusion transcripts. F1 to F3, Three fusion transcripts; M, marker.

