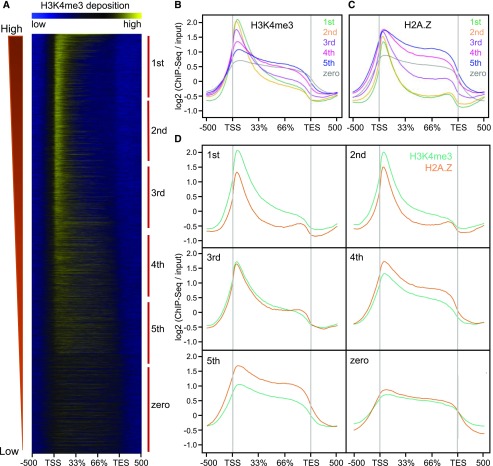
Figure 2.
Correlations of H3K4me3 and H2A.Z distribution with gene expression for rice PCGs. A, Heat map of H3K4me3 distribution from 500 bp upstream of the TSS to 500 bp downstream of the TES in control shoot samples for six gene groups ordered based on transcript abundance level (FPKMs), defined as first (highest) to fifth (lowest) or no expression (zero). B, C, and D, Distribution of H3K4me3 (B) or H2AZ (C) or both (D) at the same gene groups as in (A). Control input reads were used for ChIP-Seq read normalization.

