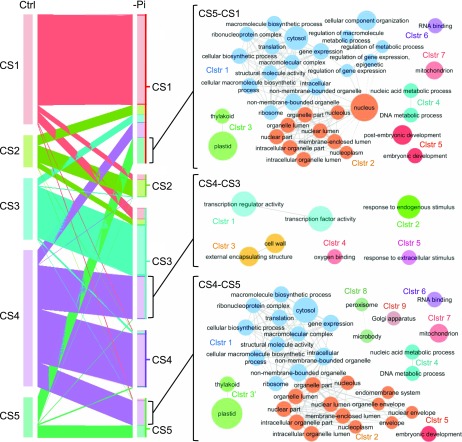
Figure 4.
CS transitions of PCGs from control (Ctrl) to phosphate-starved (−Pi) conditions. Left, The size of each segment represents the number of genes in each CS and the width of each ribbon represents the number of genes with a transition to another CS. Right, Networks representing GO MCL terms enriched in CS5-CS1, CS4-CS3, and CS4-CS5 groups. The program Cytoscape was used to visualize enriched GO terms. Node (circle) size represents the number of genes in each node.

