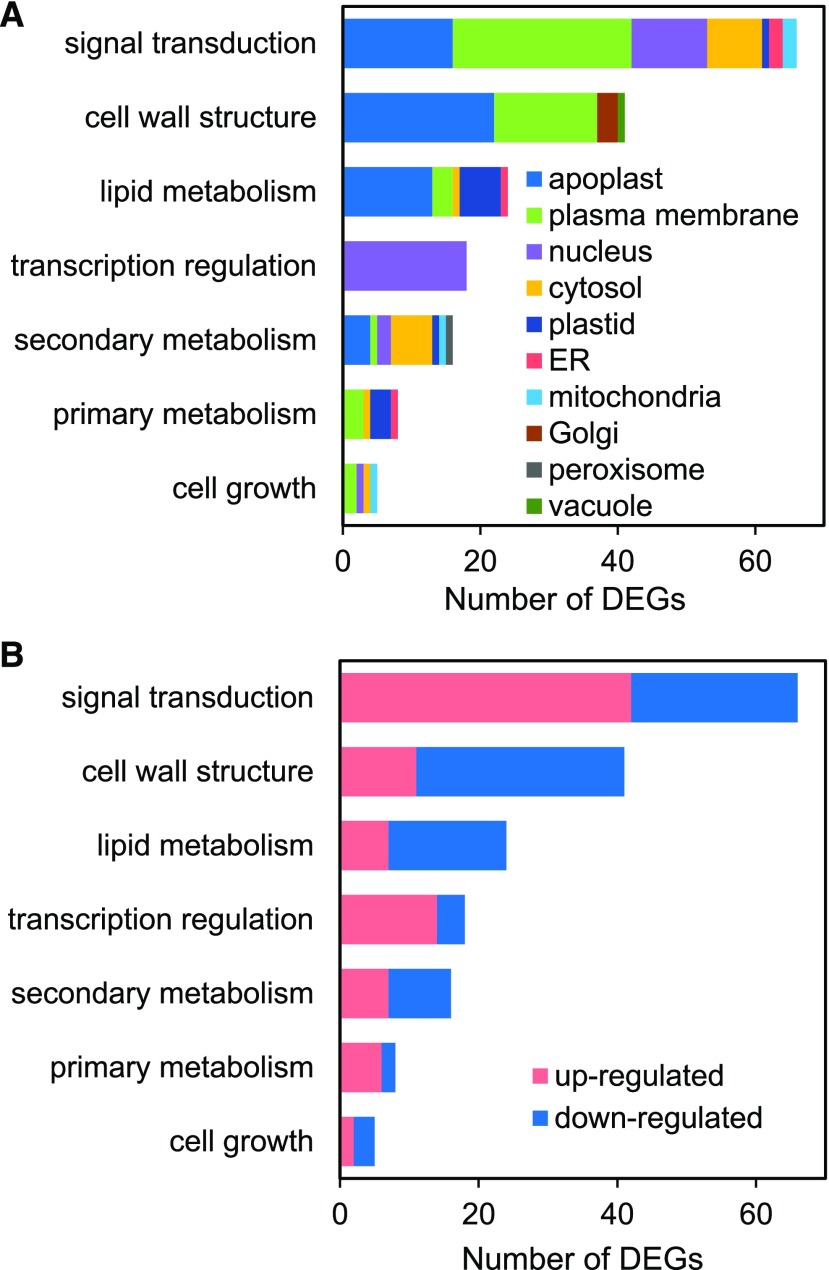
Figure 6.
Predicted functions and subcellular locations of DEGs having a CS transition of CS4 to CS3. DEGs are grouped based on the putative functional categories shown. A, The number of DEGs predicted to localize to distinct subcellular locations. B, The number of DEGs that are up- or downregulated in each functional category.

