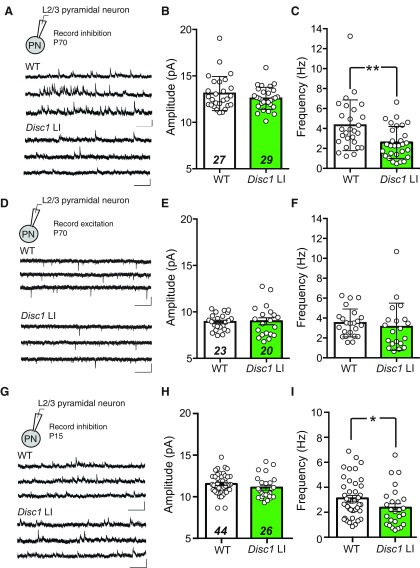
Figure 1.
Reduced inhibitory synaptic transmission onto L2/3 pyramidal neurons in the mPFC of adult and juvenile Disc1 LI mice. A, Recording configuration and sample mIPSC traces recorded from L2/3 PNs in the mPFC of WT (upper) and Disc1 LI (lower) mice at ∼P70. B, mIPSC amplitude (WT, n = 27 cells; Disc1 LI, n = 29 cells). C, mIPSC frequency (WT, n = 27 cells; Disc1 LI, n = 29 cells; **p < 0.01, Mann–Whitney U test). D, Recording configuration and sample mEPSC traces recorded from L2/3 PNs in the mPFC of WT (upper) and Disc1 LI (lower) mice at ∼P70. E, mEPSC amplitude (WT, n = 23 cells; Disc1 LI, n = 20 cells). F, mEPSC frequency (WT, n = 23 cells; Disc1 LI, n = 20 cells). G, Recording configuration and sample mIPSC traces recorded from L2/3 PNs in the mPFC of WT (upper) and Disc1 LI (lower) mice at ∼P15. mIPSC (H) amplitude (WT, n = 44 cells; Disc1 LI, n = 26 cells; p = 0.12, t test) and (I) frequency (WT, n = 44 cells; Disc1 LI, n = 26 cells; *p < 0.05, Mann–Whitney U test). All scale bars represent 20 pA, 500 ms. Bar graphs indicate median ± interquartile range (B, C, F, I) or mean ± SEM (E, H), as appropriate.

