Figure 6.

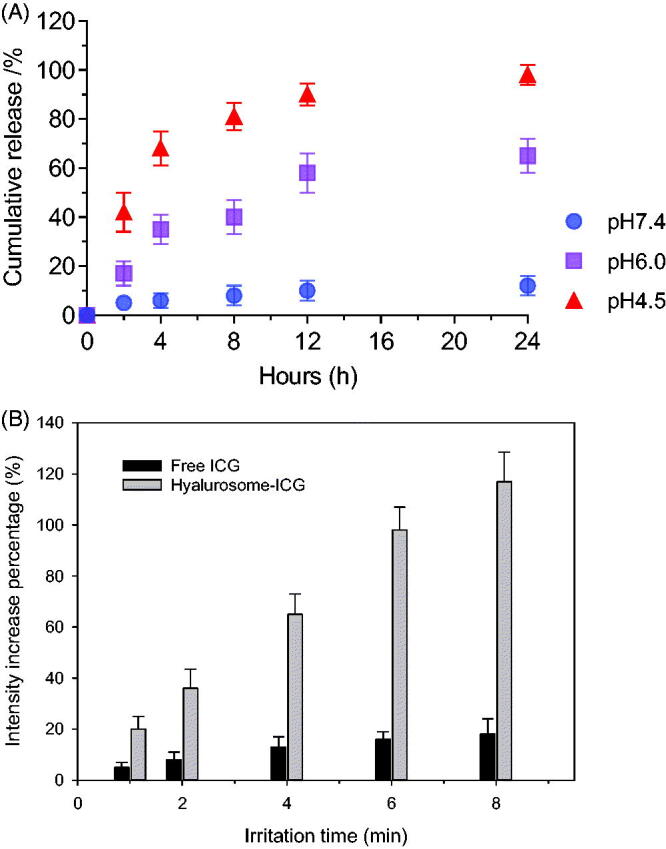
(A) In vitro release profiles of ICG from hyalurosomes in media at different pH levels. (B) The increase percentage of SOSG fluorescence intensities of the free and hyalurosome-encapsulated ICG.

(A) In vitro release profiles of ICG from hyalurosomes in media at different pH levels. (B) The increase percentage of SOSG fluorescence intensities of the free and hyalurosome-encapsulated ICG.