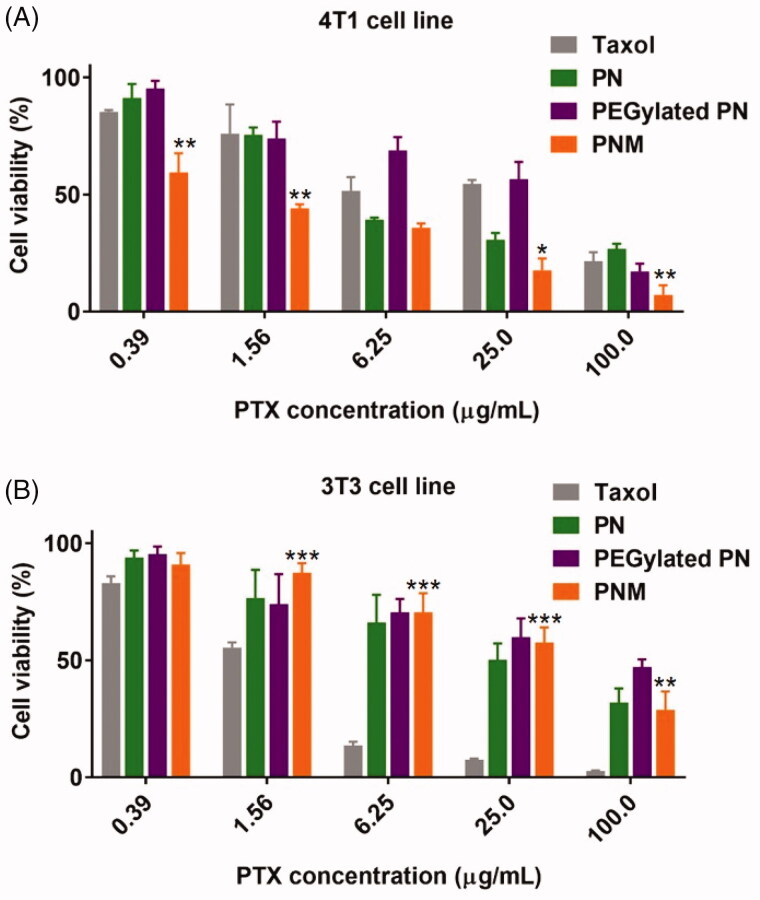
Figure 5.
Cytotoxicity of formulations on cell lines. (A) Cytotoxicity of formulations on 4T1 murine breast cancer cell line for 48 h incubation, * p < 0.05 vs PN, ** p < 0.01 vs PN; (B) Cytotoxicity of formulations on 3T3 murine fibroblast cell line for 48 h incubation, **p < 0.01 vs Taxol, *** p < 0.001 vs Taxol; error indicated ± SD (n = 4).

