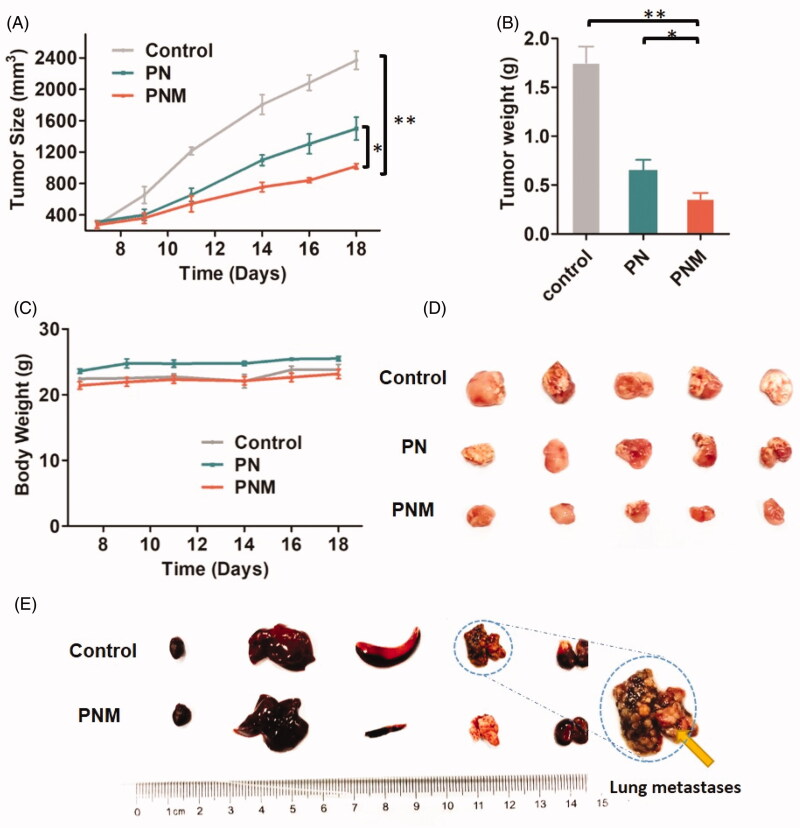
Figure 7.
In vivo antitumor activity of different PTX formulations against 4T1-xenografted BALB/c mice. (A) Tumor growth curve of different mouse groups with administrations of saline, PN (PTX dose 10 mg/kg) and the PNM (PTX dose 10 mg/kg); (B) Weight of ex vivo tumors from the mice sacrificed by cervical dislocation at the experimental end point; (C) Body weight change of mice in different groups; (D) Image of excised tumors from different groups; (E) Representative organs of mice from control group and PNM treated group, metastatic nodules of lung tissue from control group directed by yellow arrow; error bars indicated ± SD (n = 5 for each group), *p < 0.05, **p < 0.01.

