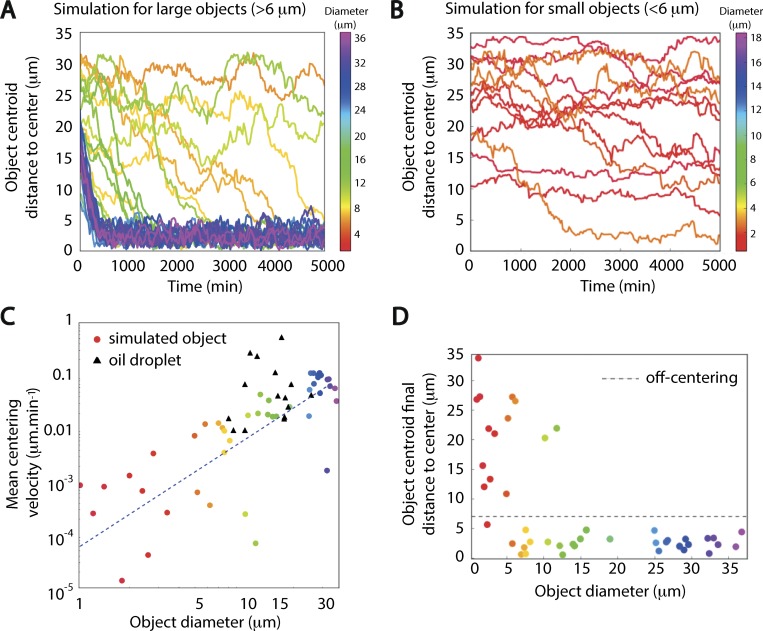
Figure 4.
Prediction from simulations of object behavior as a function of object size. (A) Evolution of the distance of the nucleus centroid to the oocyte center in 30 different simulations for objects with a diameter >6 µm. One line corresponds to one simulation, and the color indicates the value of the diameter for each object (heat map of diameter sizes is presented on the right scale bar). Most objects are centered before 5,000 min. (B) Evolution of the distance of the nucleus centroid to the oocyte center in 15 different simulations for objects with a diameter <6 µm. One line corresponds to one simulation, and the color indicates the value of the diameter for each object (heat map of diameter sizes is presented on the right scale bar). The small objects are not centered even after 5,000-min-long simulations. (C) Nucleus centroid mean centering velocity (as defined in Fig. 6 B) in the 45 simulations from A and B as a function of object diameter (colored circles) and mean centering velocity of the oil droplets in our experiments as a function of their diameter (black triangles). The fitted line (dotted blue line) follows the expected relation v ~ R2 from the Archimedes principle for the simulated data (v = 0.00024 R2, Spearman correlation of 0.8 with P = 10−11). (D) Final distance of the object centroid to the oocyte center, as a function of the object diameter for the 45 simulations. Objects ending up within 7 µm of the oocyte center (dashed gray line) at the end of the simulation are considered centered (as defined in Fig. 6 B).

