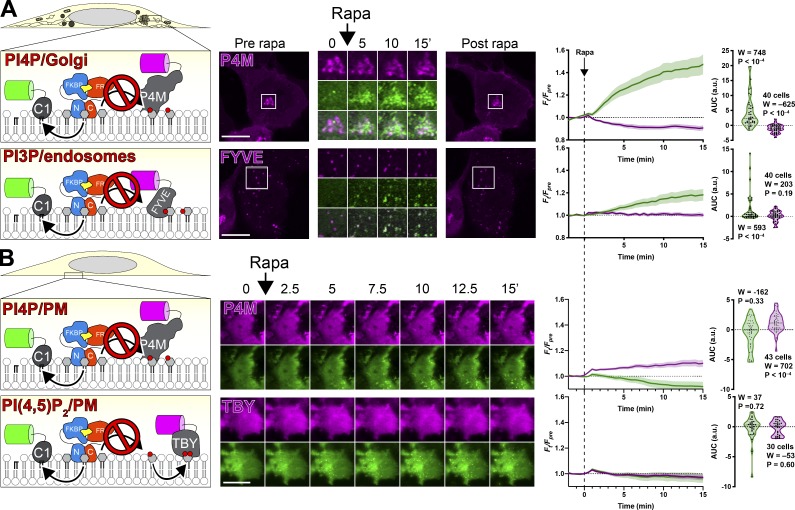
Figure 4.
PI-PLC leads to little or no depletion of PPIn on Golgi and endosomes or PM. (A and B) Cells were transfected with PI-PLCC100-FRB, FKBP-PI-PLCN100 (or PM-targeted LynN11-FKBP-PI-PLCN100), and GFP-PKD1-C1ab to detect DAG, along with the indicated PPIn biosensor. Dimerization and activation of PI-PLC was induced with 1 µM rapamycin as indicated. Images are confocal sections (A) or TIRFM (B). Scale bars = 20 µm. Inset = 10 µm for P4M and 15 µm for FYVE. Line graphs show the change in compartment-specific fluorescence of C1ab (green) or the PPIn biosensor (magenta) normalized to prerapamycin levels (Fpre). The violin plots show AUC, with the number of cells (pooled across three independent experiments), the sum of signed ranks (W), and P value from a two-tailed Wilcoxon signed rank test compared to a null hypothesis AUC value of 0 (with a baseline of 1).

