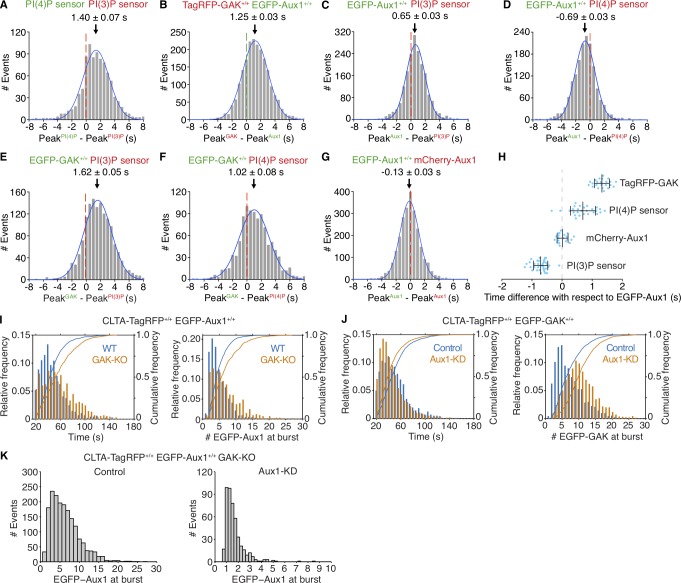
Figure 3.
Recruitment of Aux1, GAK, and phosphoinositide sensors to clathrin-coated vesicles. (A–H) Bottom (adherent) surfaces of cells transiently expressing various combinations of Aux1, GAK, and Aux1-based PtdIns(3)P and PtdIns(4)P sensors imaged by TIRF microscopy every 0.5 s for 100 s. (A) Transient coexpression of Aux1-based PtdIns(4)P (EGFP-P4M(DrrA)-Aux1) and PtdIns(3)P (mCherry-2xFYVE(Hrs)-Aux1) sensors in parental SUM159 cells. Distribution (single Gaussian fit) for the interval between the peaks within single events: the PtdIns(3)P sensor precedes the PtdIns(4)P sensor by 1.40 ± 0.07 s (mean ± SE, 916 traces from 34 cells). (B) Distribution of interval between the peaks within single events of EGFP-Aux1 and TagRFP-GAK in cells double-edited for EGFP-Aux1+/+ and TagRFP-GAK+/+ (1.25 ± 0.03 s, mean ± SE, 2,033 traces from 23 cells). (C and D) Transient expression of PtdIns(3)P (mCherry-2xFYVE(Hrs)-Aux1; C) or PtdIns(4)P (mCherry-P4M(DrrA)-Aux1) sensor (D) in gene-edited EGFP-Aux1+/+ cells. Distributions of interval between burst peaks for Aux1 and phosphoinositide sensors in the same event. Aux1 and PtdIns(3)P sensor: 0.65 ± 0.03 s, mean ± SE, 1,863 traces in 35 cells; Aux1 and PtdIns(4)P sensor: −0.69 ± 0.03 s; 1,570 traces in 27 cells. (E and F) Transient expression of PtdIns(3)P (mCherry-2xFYVE(Hrs)-Aux1; E) or PtdIns(4)P (mCherry-P4M(DrrA)-Aux1) sensor (F) in gene-edited EGFP-GAK+/+ cells. Distributions of interval between burst peaks for GAK and phosphoinositide sensors in the same event. GAK and PtdIns(3)P sensor (1.62 ± 0.05 s; 1,435 traces in 36 cells); GAK and PtdIns(4)P sensor (1.02 ± 0.08 s; 1,020 traces in 34 cells). (G) Transient expression of mCherry-Aux1 in gene-edited EGFP-Aux1+/+ cells. Distribution of interval between burst peaks for mCherry-Aux1 and EGFP-Aux1 in the same event (−0.13 ± 0.03 s; 2,435 traces in 34 cells). (H) Interval between burst peaks of Aux1 in gene-edited EGFP-Aux1+/+ cells and of TagRFP-GAK+/+ gene edited in the same cells (n = 23 cells), or between the burst peaks of Aux1 in gene-edited EGFP-Aux1+/+ cells and transiently expressed PtdIns(4)P sensor (mCherry-P4M(DrrA)-Aux1, n = 27 cells), mCherry-Aux1 (n = 34 cells), or PtdIns(3)P sensor (mCherry-2xFYVE(Hrs)-Aux1, n = 35 cells). The values of each spot represent the average (mean ± SD) of the measurement obtained for a given single cell. The timing differences between the bursts for each group were statistically significant (P < 0.001 by one-way ANOVA with Tukey’s comparison test). (I) Effect of GAK knockout on recruitment of Aux1 to endocytic clathrin-coated vesicles in cells gene edited for EGFP-Aux1+/+ and CLTA-TagRFP+/+. Histogram and cumulative distributions showing increases in the number of EGFP-Aux1 molecules recruited during the burst (Cohen’s d = 0.45) and in the lifetime (Cohen’s d = 0.57) of clathrin-coated structures, determined in 1,272 traces from 14 WT cells and in 794 traces from 14 knockout (GAK-KO) cells. (J) Effect of Aux1 knockdown by shRNA on recruitment of GAK to endocytic clathrin-coated vesicles, in cells gene edited for EGFP-GAK+/+ and CLTA-TagRFP+/+. Histogram and cumulative distributions for the number of EGFP-Aux1 molecules recruited during the burst (Cohen’s d = 0.73) and the lifetimes of the clathrin-coated structures (Cohen’s d = 0.29), determined in 1,498 traces from 15 control cells and in 1,793 traces from 14 knockdown (Aux1-KD) cells. (K) Effect of GAK knockout and Aux1 knockdown by siRNA on recruitment of Aux1 to endocytic clathrin-coated vesicles, in cells gene edited for EGFP-Aux1+/+ and CLTA-TagRFP+/+ and knockout for GAK. Histogram distributions for the number of EGFP-Aux1 molecules recruited during the burst of clathrin-coated structures, determined in 1,794 traces from 20 control cells and in 465 traces from 47 knockdown (Aux1-KD) cells.

