Figure 5.
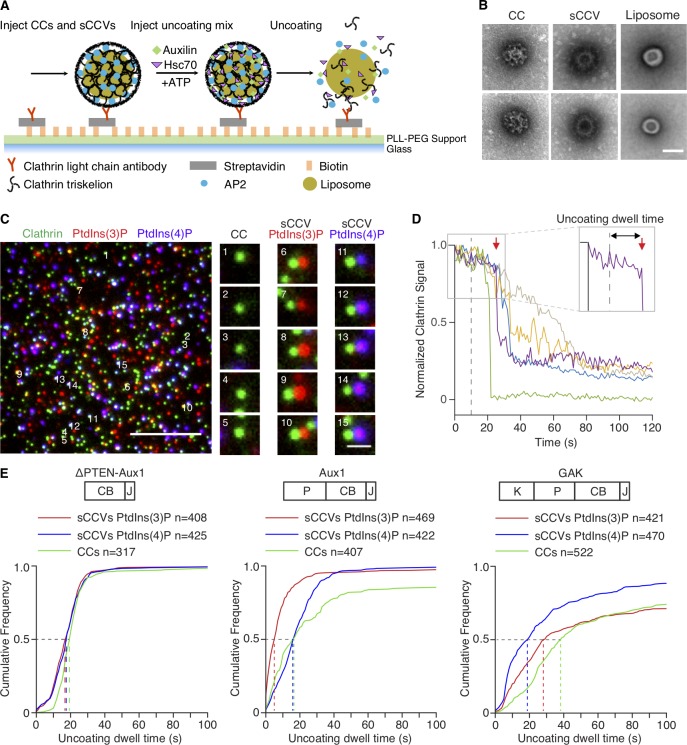
Single-particle in vitro uncoating assay. (A) Schematic representation of the assay. The intensities of fluorescence from labeled clathrin and lipid dyes incorporated into liposomes surrounded by clathrin/AP2 coats were monitored by TIRF microscopy. Synthetic clathrin/AP2-coated vesicles (shown in the figure) and clathrin/AP2 coats were captured with a biotinylated monoclonal antibody specific for clathrin light chain on the surface of a poly(l-lysine)-poly(ethylene glycol)-Biotin-Streptavidin modified glass coverslip in a microfluidic chip. (B) Representative transmission EM images of negatively stained clathrin/AP2 coats (CC; left), synthetic clathrin/AP2 coated vesicles (sCCV; middle), or liposomes (right). Scale bar, 50 nm. (C) Representative TIRF image before initiation of uncoating. The snapshot combines images acquired in three different fluorescence channels (red and blue channels in enlarged images shifted right by 5 pixels) used to monitor the signal from coats and synthetic coated vesicles tagged with clathrin LCa-AF488 (green) and synthetic coated vesicles containing PtdIns(3)P or PtdIns(4)P and DiI (red) or DiD (blue), respectively. Scale bars, 5 µm (left) and 1 µm (right). (D) Representative uncoating profiles from single sCCVs. Plots show fluorescence intensity traces of the clathrin signal imaged at 1-s intervals starting 10 s before arrival of the uncoating mix (dashed vertical line at 0 s). Abrupt loss of signal in the green trace represents early release of the synthetic coated vesicle from the antibody on the glass surface. The enlarged boxed region (right corner) illustrates with a red arrow the onset of the uncoating reaction of the purple trace; the “uncoating dwell time” is the time it took to reach this point. (E) Cumulative distributions of uncoating dwell times of clathrin/AP2 and sCCVs containing PtdIns(4,5)P2 with either PtdIns(3)P or PtdIns(4)P obtained upon incubation with ΔPTEN-Aux1, full-length Aux1, or full-length GAK (P, PTEN-like domain; CB, clathrin-binding domain; J, J domain; K, kinase domain). The uncoating dwell times corresponding to 50% of the cumulative distributions (dashed lines) are from 3–10 independent experiments.

