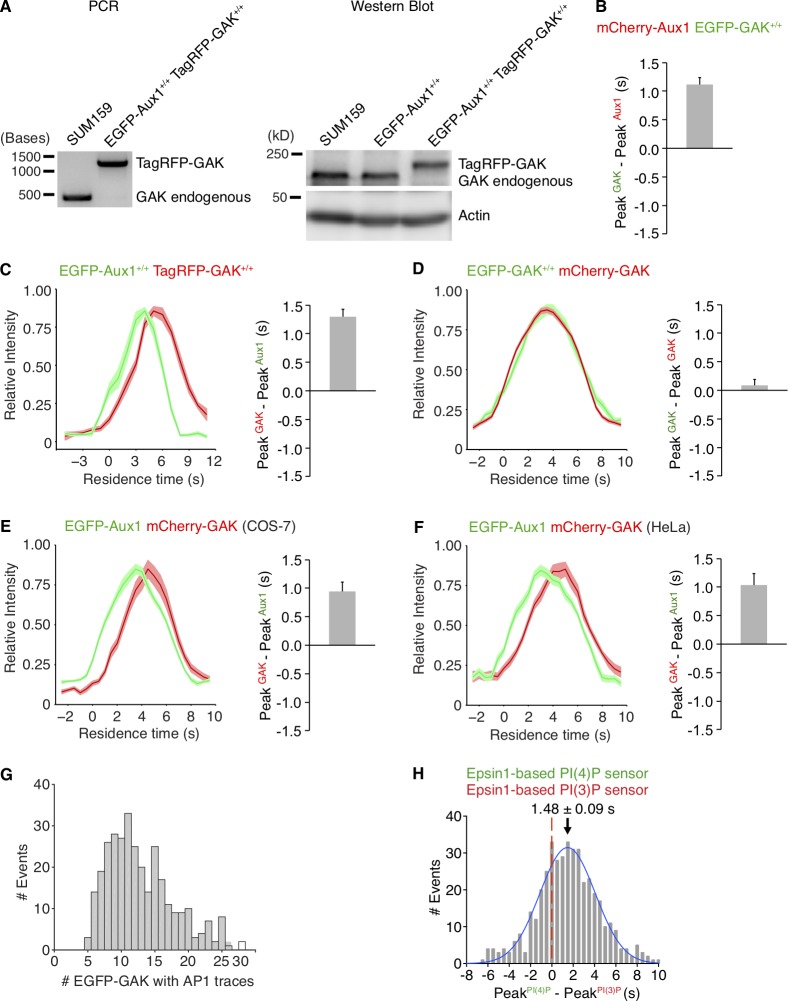
Figure S3.
Sequential bursts of Aux1 and GAK during uncoating of clathrin-coated vesicles at the plasma membrane and recruitment of GAK to the intracellular clathrin-containing carriers. (A) The TagRFP sequence was inserted into the GAK genomic locus of the EGFP-Aux1+/+ cells to generate the double-edited cells EGFP-Aux1+/+ and TagRFP-GAK+/+, as confirmed by genomic PCR analysis (left) and Western blot analysis probed with antibodies for GAK and actin (right). (B) Gene-edited EGFP-GAK+/+ cells transiently expressing mCherry-Aux1 were imaged at 0.5-s intervals for 60 s by TIRF microscopy. The average time interval between the peaks of intensity for EGFP-GAK and mCherry-Aux1 is shown (mean ± SD, n = 8 cells). (C) Bottom surfaces of EGFP-Aux1+/+ and TagRFP-GAK+/+ cells were imaged at 1-s intervals for 120 s by TIRF microscopy. Left: Averaged fluorescence intensity traces (mean ± SE) of both EGFP-Aux1 (green) and TagRFP-GAK (red) for the EGFP-Aux1 3–12-s cohort (1,560 traces from 12 cells). Right: Average time interval between the peaks of intensity for EGFP-Aux1 and TagRFP-GAK (mean ± SD, n = 6 cells). (D) Gene-edited EGFP-GAK+/+ cells transiently expressing mCherry-GAK were imaged at 0.5-s intervals for 60 s by TIRF microscopy. Left: Averaged fluorescence intensity traces (mean ± SE) of EGFP-GAK (green) and mCherry-GAK (red) from the EGFP-GAK 3–12-s cohort (2,306 traces from 15 cells). Right: Average interval between the peak intensities of EGFP-GAK and mCherry-GAK (mean ± SD, n = 15 cells). (E) COS-7 cells transiently expressing EGFP-Aux1 and mCherry-GAK were imaged at 0.5-s intervals for 60 s by TIRF microscopy. Left: Averaged fluorescence intensity traces (mean ± SE) of EGFP-Aux1 (green) and mCherry-GAK (red) from the EGFP-Aux1 3–12-s cohort (656 traces from nine cells). Right: Average interval between the peak intensities of EGFP-Aux1 and mCherry-GAK (mean ± SD, n = 9 cells). (F) HeLa cells transiently expressing EGFP-Aux1 and mCherry-GAK were imaged at 0.5-s intervals for 60 s by TIRF microscopy. Left: Averaged fluorescence intensity traces (mean ± SE) of EGFP-Aux1 (green) and mCherry-GAK (red) from the EGFP-Aux1 3–12-s cohort (595 traces from 11 cells). Right: Average interval between the peak intensities of EGFP-Aux1 and mCherry-GAK (mean ± SD, n = 11 cells). (G) Gene-edited EGFP-GAK+/+ cells stably expressing AP1-TagRFP were imaged in 3D by lattice light-sheet microscopy. Distribution of the maximum number of EGFP-GAK molecules recruited to individual AP1-coated carriers (325 traces from 11 cells). (H) Bottom surfaces of cells transiently expressing Epsin1-based PtdIns(4)P sensor EGFP-P4M(DrrA)-Dlv2(508–736)-Epsin1(255–501) and PtdIns(3)P sensor mCherry-2xFYVE(Hrs)-Dlv2(508–736)-Epsin1(255–501) imaged by TIRF microscopy every 0.5 s for 100 s. Distribution (fit with a single Gaussian) for the interval between the peaks within single events showing that the Epsin1-based PtdIns(3)P sensor precedes the PtdIns(4)P sensor by 1.48 ± 0.09 s (mean ± SE, 436 traces from 23 cells).

