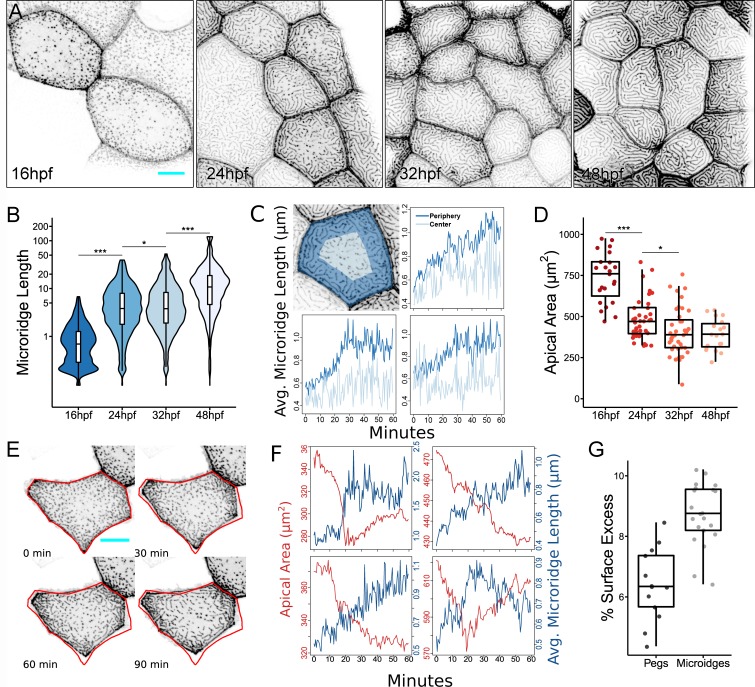
Figure 1.
Microridge length changes in tandem with apical cell area. (A) Representative projections of Lifeact-GFP in periderm cells on zebrafish larvae at the indicated stages of zebrafish development. (B) Box and violin plot of microridge length at the indicated stages of zebrafish development. Data displayed are a weighted distribution of microridge length, in which frequency is proportional to microridge length, approximating occupied area. For a nonweighted presentation of the same data, see Fig. S1 K. *, P < 0.05; ***, P < 0.001; Kruskal–Wallis test followed by Dunn’s test (n = 15,582 structures in 23 cells from 10 fish at 16 hpf; n = 5,096 structures in 40 cells from nine fish at 24 hpf; n = 4,572 structures in 40 cells from nine fish at 32 hpf; n = 1,309 structures in 19 cells from six fish at 48 hpf). (C) Top left: Representation of cell “periphery” (dark blue) and “center” (light blue) zones, representing 75% and 25% of apical cell area, respectively. Other panels: Line graphs comparing the average microridge length in the cell periphery versus the cell center over time. (D) Dot and box plot of periderm cell apical area at the indicated stages of zebrafish development. *, P < 0.05; ***, P < 0.001; Kruskal–Wallis test followed by Dunn’s test (n = 23 cells from 10 fish at 16 hpf; n = 40 cells from nine fish at 24 hpf; n = 40 cells from nine fish at 32 hpf; n = 19 cells from six fish at 48 hpf). (E) Sequential projections from a time-lapse video of Lifeact-GFP in a single periderm cell during apical constriction. Red outline shows position of cell border at 0 min. (F) Line plots of apical area and average microridge length in single periderm cells over time. Top right panel corresponds to cell shown in E. (G) Dot and box plot of surface excess (relative difference between total surface area and projected surface area as seen in microscope) in regions of the apical cell membrane composed of only microridges or only pegs (n = 13 regions with pegs, n = 21 regions with microridges). Further details of this analysis are provided in Materials and methods. Scale bars, 10 µm (A and E). Avg., average. For box plots, middle box line is the median, and lower and upper ends of boxes are 25th and 75th percentiles, respectively.

