Figure 3.
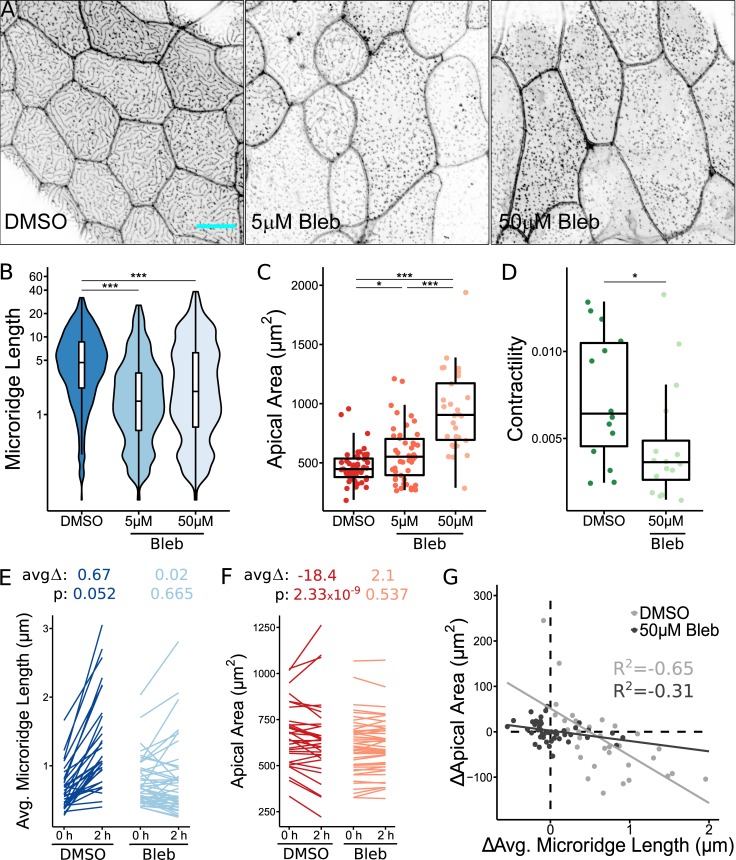
NMII contraction is required for apical constriction and microridge development. (A) Representative projections of Lifeact-GFP in periderm cells on 40 hpf zebrafish larvae after 24-h treatment with either 1% DMSO or indicated concentration of blebbistatin (Bleb). (B) Box and violin plot of microridge length in 40 hpf zebrafish embryos after 24-h treatment with either 1% DMSO or indicated concentration of blebbistatin. Data are presented as a weighted distribution of microridge length, in which frequency is proportional to length, approximating occupied area. ***, P < 0.001; Kruskal–Wallis test followed by Dunn’s test (n = 6,772 structures in 53 cells from 10 fish for 1% DMSO, n = 9,587 structures in 46 cells from 11 fish for 5 µM blebbistatin; n = 8,623 structures in 29 cells from 13 fish for 50 µM blebbistatin). (C) Dot and box plot of periderm cell apical area in 40 hpf zebrafish embryos after 24-h treatment with either 1% DMSO or indicated concentration of blebbistatin. *, P < 0.05; ***, P < 0.001; Kruskal–Wallis test followed by Dunn’s test (n = 53 cells from 10 fish for 1% DMSO, n = 46 cells from 11 fish for 5 µM blebbistatin, n = 29 cells from 13 fish for 50 µM blebbistatin). (D) Dot and box plot of frame average NMII reporter contraction area summed over a 10-min period (30-s intervals), after 1-h treatment with either 1% DMSO or 50 µM blebbistatin. *, P < 0.05; Wilcoxon rank-sum test (n = 10,416 contractions in 29 cells from 18 fish for 1% DMSO, n = 2,259 contractions in 16 cells from nine fish for 50 µM blebbistatin). (E) Line plots of average microridge length in individual periderm cells before (18 hpf) and after (20 hpf) 2-h treatment with either 1% DMSO or 50 µM blebbistatin. Above, average change in average microridge length and P values (Wilcoxon signed-rank test; n = 17,039 structures in 64 cells from 10 fish for 1% DMSO, n = 20,873 structures in 92 cells from 11 fish for 50 µM blebbistatin). (F) Line plots of periderm cell apical area in individual cells before (18 hpf) and after (20 hpf) 2-h treatment with either 1% DMSO or 50 µM blebbistatin. Above, average change in periderm cell apical area and P values (Wilcoxon signed-rank test; n = 64 cells from 10 fish for 1% DMSO, n = 92 cells from 11 fish for 50 µM blebbistatin). (G) Scatter plot of change in average microridge length versus change in periderm cell apical area after 2-h treatment with 1% DMSO or 50 µM blebbistatin. R2 determined using Pearson’s correlation coefficient (n = 17,039 structures in 64 cells from 10 fish for 1% DMSO, n = 20,873 structures in 92 cells from 11 fish for 50 µM blebbistatin). Scale bar, 10 µm (A). For box plots, middle box line is the median, and lower and upper ends of boxes are 25th and 75th percentiles, respectively.

