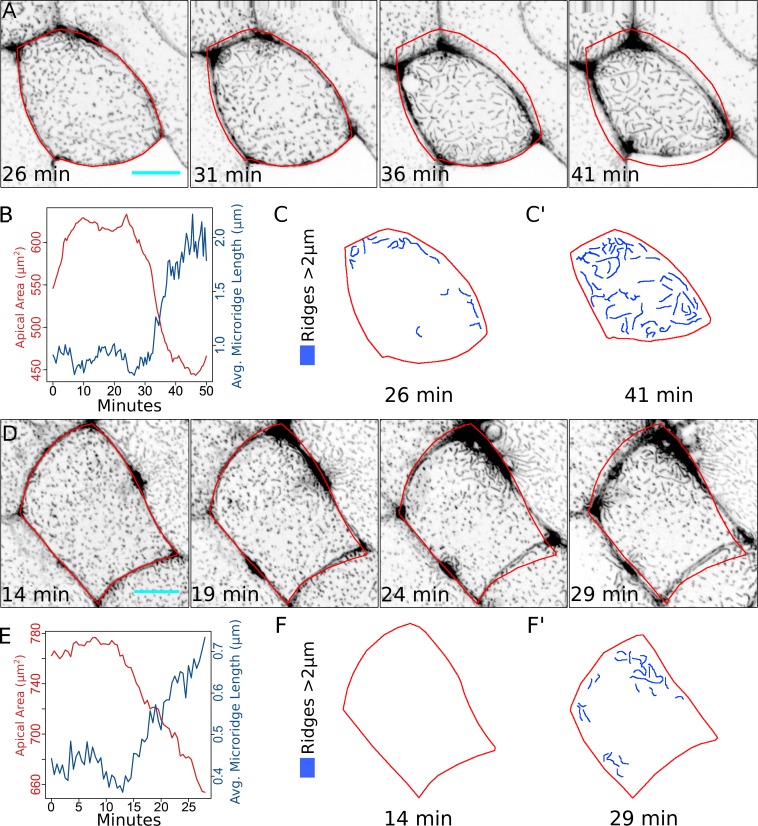
Figure 6.
Membrane surface energy regulates microridge formation. (A) Sequential projections from a time-lapse video of Lifeact-GFP in periderm cells after exposure to water with 500× Instant Ocean salt. Red outline shows position of cell border at 26 min. (B) Line plot of apical area and average microridge length in the periderm cell shown in A after exposure to water with 500× Instant Ocean salt. (C and C’) Diagram of cell in A at the indicated time points with microridges longer than 2 µm traced in blue. (D) Sequential projections from a time-lapse video of Lifeact-GFP in periderm cells after exposure to 12.5% glycerol. Red outline shows position of cell border at 14 min. (E) Line plot of apical area and average microridge length in the cell shown in D after exposure to 12.5% glycerol. (F and F’) Diagram of cell in E at the indicated time points with microridges longer than 2 µm traced in blue. Scale bars, 10 µm (A and D).

