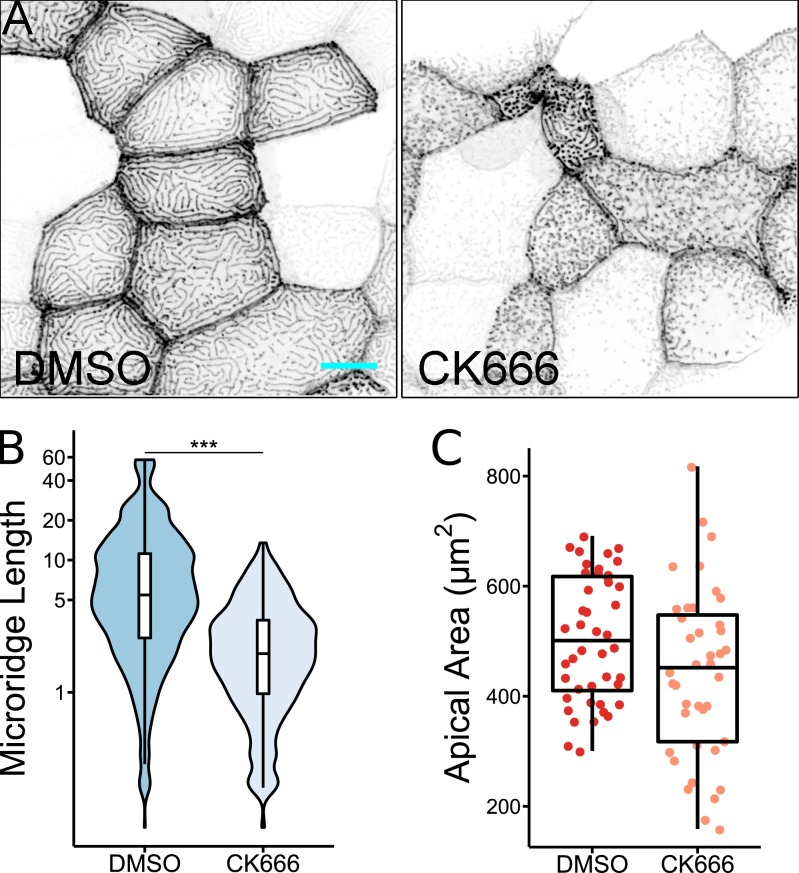
Figure S4.
Arp2/3 activity is required for microridge development, but not apical constriction. (A) Representative projections of Lifeact-GFP in periderm cells on 24 hpf zebrafish larvae after 8-h treatment with either 1% DMSO or 100 µM CK666. (B) Box and violin plot of microridge length in 24 hpf zebrafish larvae after 8-h treatment with either 1% DMSO or 100 µM CK666. Data displayed are a weighted distribution of microridge length where frequency is proportional to microridge length, approximating occupied area. ***, P < 0.001; Wilcoxon rank-sum test (n = 5,283 structures in 44 cells from 11 fish for 1% DMSO, n = 6,130 structures in 40 cells from 12 fish for 100 µM CK666). (C) Dot and box plot of periderm cell apical area in 24 hpf zebrafish embryos after 8-h treatment with either 1% DMSO or 100 µM CK666. P = 0.052; Wilcoxon rank-sum test (n = 44 cells from 11 fish for 1% DMSO, n = 40 cells from 12 fish for 100 µM CK666). Scale bar, 10 µm (A). For box plots, middle box line is the median, and lower and upper ends of boxes are 25th and 75th percentiles, respectively.

