Figure 6.
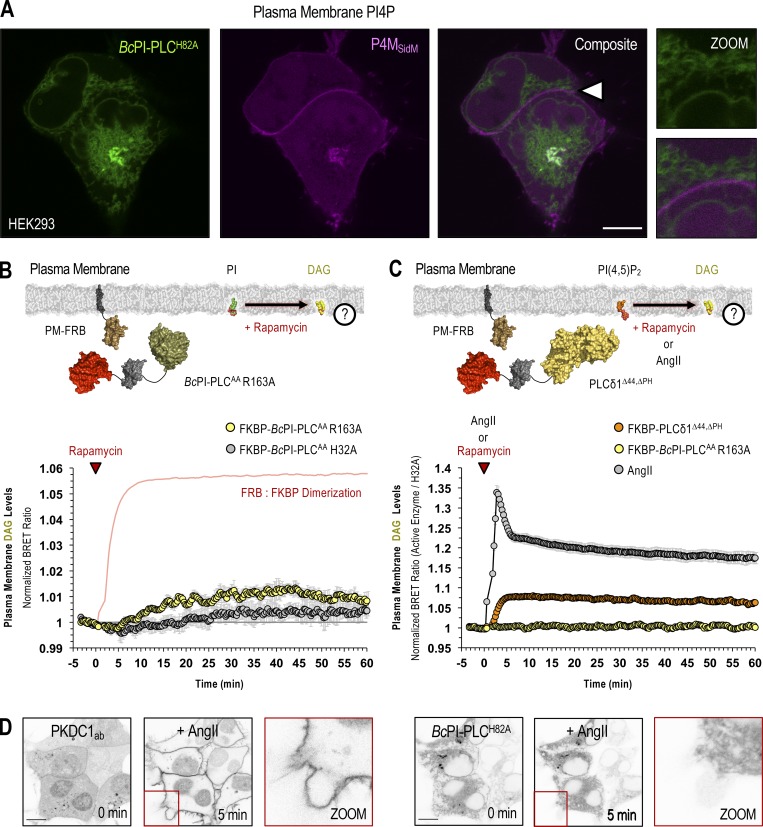
Steady-state levels of PI are low in the PM. (A) Confocal images of HEK293-AT1 cells coexpressing EGFP–BcPI-PLCH82A with the PI4P-binding probe, mCherry-P4MSidM (scale bar, 10 µm). An enlarged view of the region identified by the arrowhead is shown on the far right (inset, 10 µm). (B and C) For each BRET measurement, a schematic of the experimental design is provided above each quantified trace, with the question mark indicating the membrane lipid being measured. (B) Kinetics of DAG production within the cytosolic leaflet of the PM, measured by the PM-DAGBRET biosensor, after recruitment of FKBP–BcPI-PLCAA R163A to the PM. Please note that a time-matched but alternatively scaled trace shows the PM-FRB:FKBP–BcPI-PLCAA H32A dimerization kinetics (red line; see also Fig. S6 E). (C) Kinetics of DAG production within the PM, measured using the PM-DAGBRET biosensor, in response to stimulation with AngII (100 nM; gray trace) or following PM recruitment of an FKBP-tagged mammalian PLC (FKBP-PLCδ1Δ44,ΔPH; orange trace). For comparison, the normalized DAG response measured after the recruitment of FKBP–BcPI-PLCAA R163A, which is presented in B, is also included (yellow trace). BRET measurements are presented as mean values ± SEM from three independent experiments performed using triplicate wells. (D) Representative images from cells coexpressing the DAG-binding probe (mRFP-PKDC1ab; left panels) and EGFP–BcPI-PLCH82A (right panels; scale bars, 10 µm). Note the massive translocation of the DAG probe, but not the EGFP–BcPI-PLCH82A, from the cytosol to the PM after stimulation with AngII (100 nM). The enlarged image of the area marked by the red inset in the center panels is presented on the right of each image series (15-µm inset).

