Figure 9.
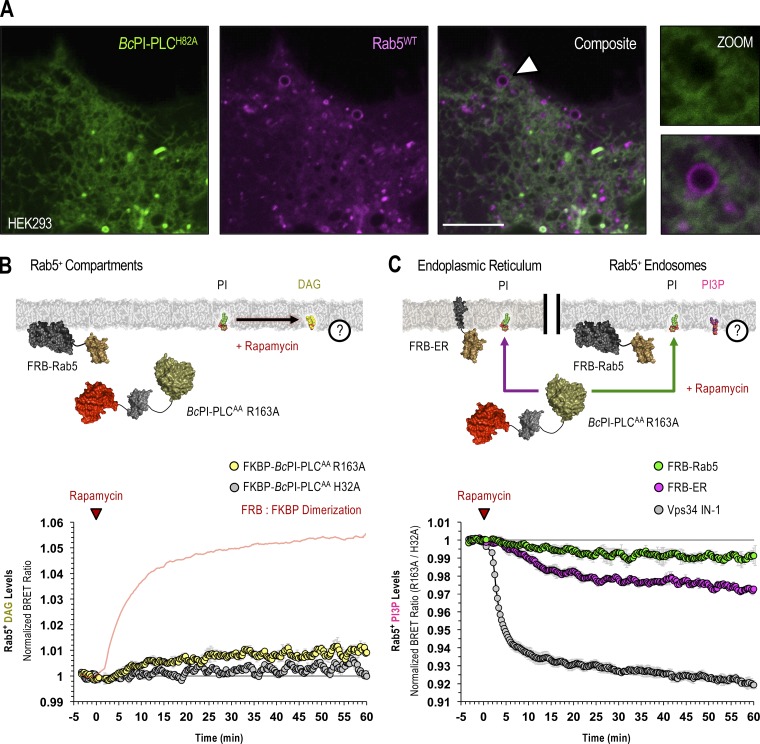
Maintenance of PI3P levels in Rab5-positive endosomes requires the delivery of PI from the ER. (A) Confocal images of HEK293-AT1 coexpressing the EGFP–BcPI-PLCH82A probe together with mCherry-Rab5WT (scale bars, 5 µm). An enlarged view of the region identified by the arrowhead is shown on the far right (inset, 2.5 µm). (B and C) For each BRET measurement, a schematic of the experimental design is provided above each quantified trace, with the question mark indicating the membrane lipid being measured. (B) Kinetics of DAG production in Rab5-positive compartments after recruitment of FKBP–BcPI-PLCAA R163A to Rab5-labeled membranes, as measured by the Rab5-DAGBRET biosensor. Please note that a time-matched but alternatively scaled trace shows the FRB-Rab5:FKBP–BcPI-PLCAA H32A dimerization kinetics (red line; see also Fig. S6 F). (C) Kinetics of PI3P levels within Rab5-positive compartments, measured using the biosensor (C; Rab5-PI3PBRET), in response to the recruitment of FKBP–BcPI-PLCAA R163A either directly to the surface of Rab5-labeled endosomes (green traces; FRB-Rab5) or to the ER (magenta traces; FRB-ER). Treatment with a selective class III PI 3-kinase inhibitor (VPS34-IN1, 300 nM; gray traces) is included as a positive control for the Rab5-specific PI3PBRET biosensor and to provide scale for any changes associated with the differential recruitment of FKBP–BcPI-PLCAA R163A to Rab5-positive endosomes or the ER. BRET measurements are presented as mean values ± SEM from three independent experiments performed using triplicate wells.

