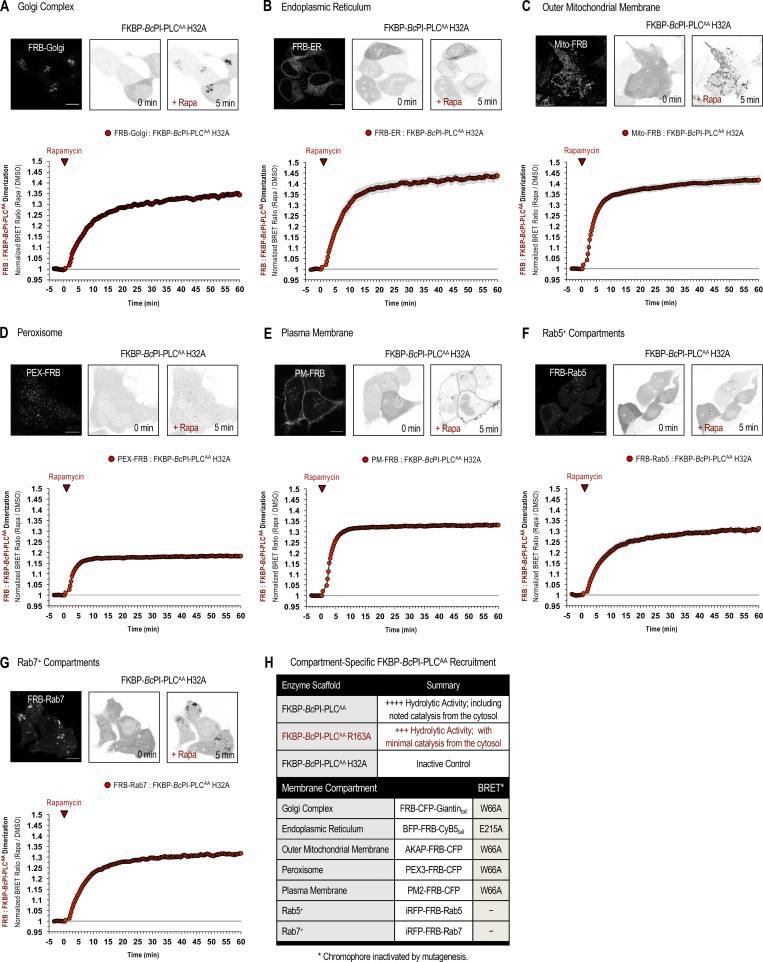
Figure S6.
Kinetics of compartment-specific recruitment of the FKBP–BcPI-PLCAA scaffold. (A–G) Representative images of HEK293-AT1 cells are shown along with population-level BRET measurements defining the FRB:FKBP dimerization kinetics for the FKBP–BcPI-PLCAA H32A scaffold upon rapamycin-induced recruitment to the Golgi complex (A), ER (B), OMM (C), peroxisomes (D), PM (E), Rab5-positive compartments (F), or Rab7-positive compartments (G). For each image series, the localization of the FRB-tagged recruiter is shown (left panels) followed by images of the mRFP-FKBP–BcPI-PLCAA H32A protein before (center panels) and 5 min after (right panels) treatment with rapamycin (100 nM; scale bars, 10 µm). For each of these BRET measurements, the single-plasmid design of the biosensors was adapted such that sLuc was tagged with FKBP–BcPI-PLCAA H32A and the mVenus fluorescent protein was conjugated to FRB and the respective membrane-specific targeting sequence. For further details related to the design of these constructs, please refer to the Materials and methods section. BRET measurements are presented as mean values ± SEM from three independent experiments performed using triplicate wells. (H) Summary table listing the most relevant FKBP–BcPI-PLCAA variants and FRB-tagged organelle recruitment constructs for use in either imaging studies or BRET experiments.

