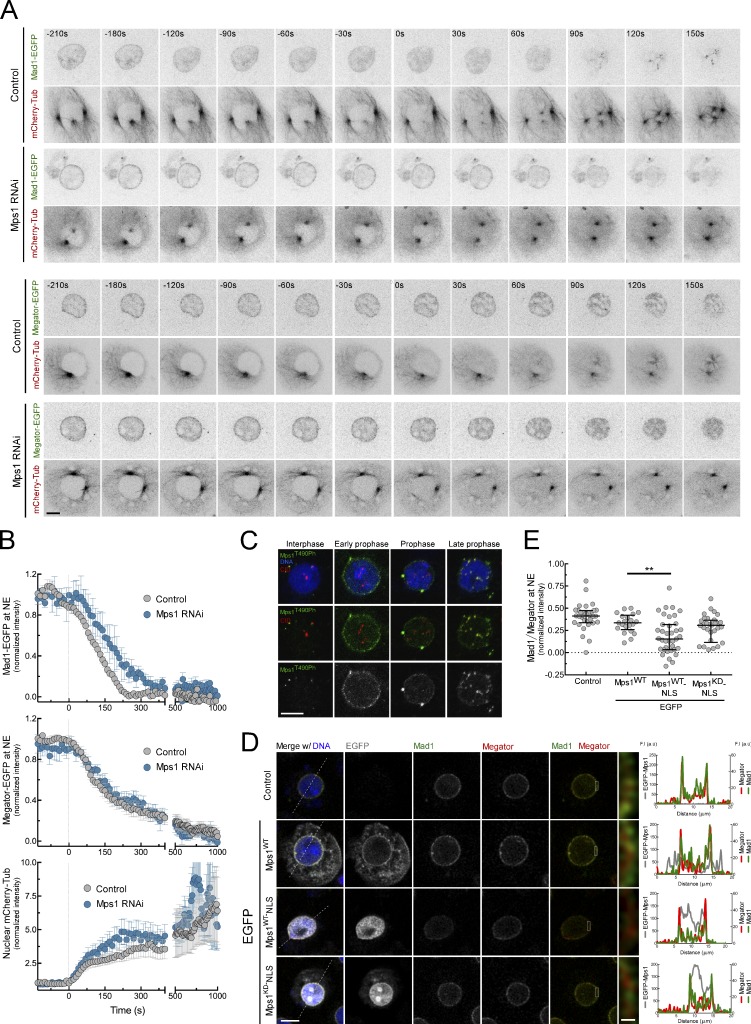
Figure 1.
Msp1 promotes the dissociation of Mad1 from NPCs during prophase. (A and B) Mitotic progression (A) and quantification (B) of Mad1-EGFP (n ≥ 7 cells) or Megator-EGFP (n ≥ 6 cells) levels at NE and of mCherry-tubulin levels in the nucleus of control and Mps1-depleted Drosophila S2 cells. Time 0 corresponds to NEB. (C) Immunofluorescence images of Mps1T490Ph localization in interphase and prophase S2 cells. (D and E) Immunofluorescence images (D) and quantifications (E) of Mad1 levels at NE of interphase control S2 cells and interphase S2 cells expressing the indicated transgenes. Graphs in D represent the intensity profiles of EGFP-Mps1, Mad1, and Megator signal along the dotted lines (n ≥ 21 cells). In B, data are presented as mean ± SD; in E, data are presented as median with the interquartile range. **, P < 0.005 (Kruskal–Wallis, Dunn’s multiple comparison test). Scale bars, 5 µm (inset, 0.5 µm).

