Figure S4.
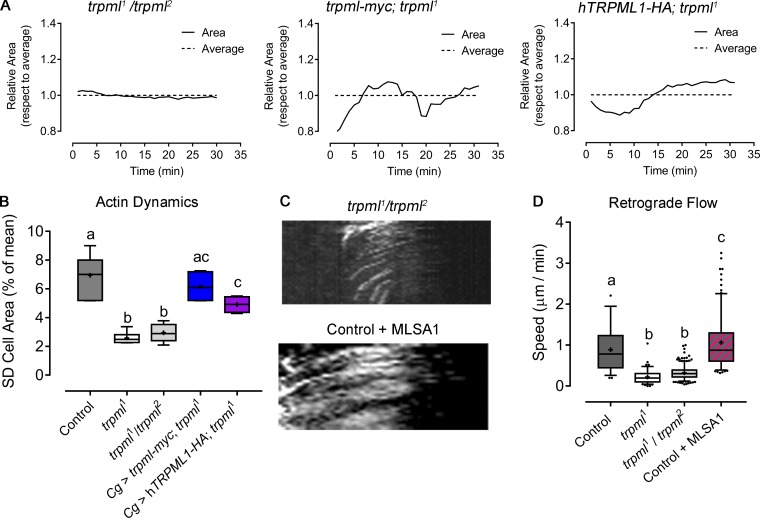
Complementation and genetic rescue of trpml1 phenotypes in actomyosin cytoskeleton. Fluorescently labeled hemocytes were cultured ex vivo, and cytoskeleton dynamics were assessed. (A) Cell dynamics in LifeAct-GFP–expressing hemocytes: trpml1/trpml2 trans-heterozygotes and trpml1 mutants expressing Drosophila trpml-myc transgene or human orthologue TRPML1-HA. Data are shown as changes in area over time with respect to average (dashed line). (B) Cell dynamics quantified as SD of the area over time (n = 3 independent experiments, n ≥ 4 cells/condition, 30-min movies, 1-min intervals). Cg, collagen Gal4 driver myc and HA, c-myc and hemagglutinin epitopes. (C) Sqh-GFP kymographs showing retrograde flow of hemocytes (30-min movies, 1-min intervals, 360°/cell): trpml1/trpml2and control supplemented with 40 µM MLSA1. (D) Retrograde flow speed quantification (n = 3 independent experiments, n ≥ 3 cells/condition). (B and D) Values are presented as box and whiskers (5%–95% in D), one-way ANOVA with Tukey's multiple comparisons post hoc test. Mean values are indicated as “+”; statistically equivalent values are represented with the same letter (P < 0.05).

