Figure 1.
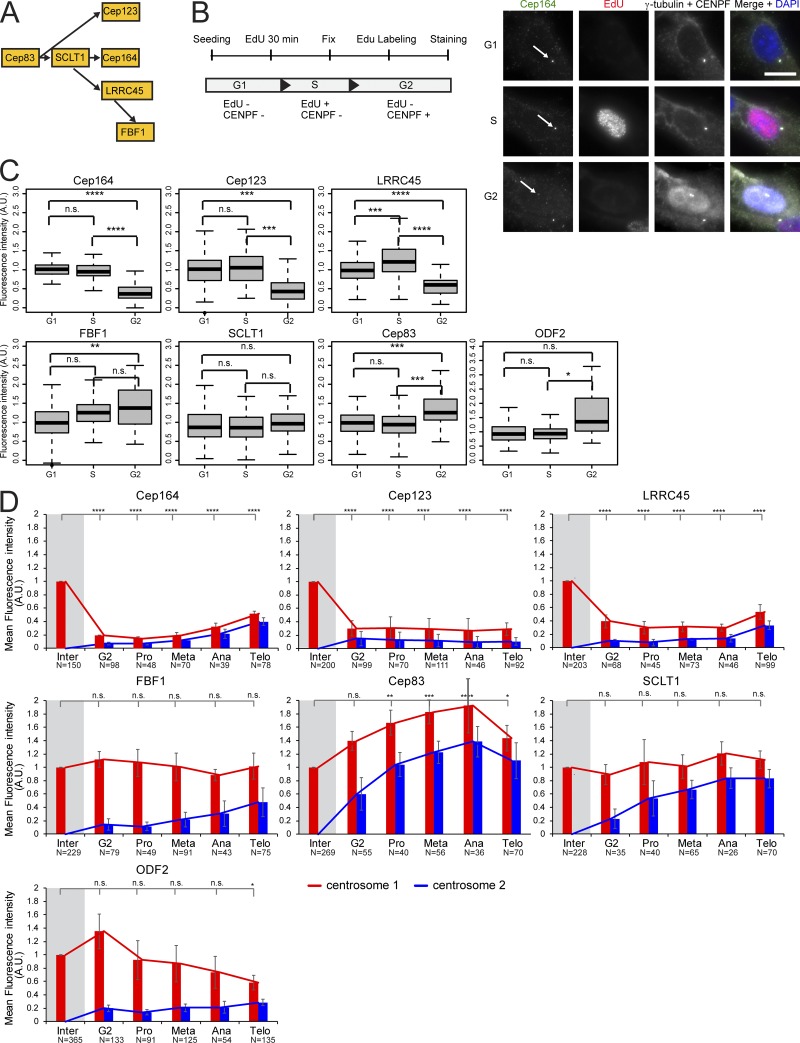
Localization of DAs at the centrosome is cell cycle dependent. (A) Hierarchy of DAs (Tanos et al., 2013; Kurtulmus et al., 2018). (B) Experimental setup to classify cells in G1, S, and G2 phases based on EdU and CENPF staining as depicted. Cells were treated with EdU and stained for Cep164. The arrows mark centrosomal Cep164. γ-tubulin labels centrosomes, and DAPI stained the DNA. Scale bar, 20 µm. (C) Quantification of B. Boxplots show the fluorescence intensity of DAs and ODF2 at centrosomes in A.U. The G1 population was used for normalization. Four independent experiments were done for LRRC45 and three independent experiments for all other proteins. Boxes show interquartile range, lines inside the box represent the median, and whiskers show minimum and maximum values excluding outliers. n = 149 (G1), 107 (S), and 32 (G2) cells per sample. (D) Quantification of cell cycle–dependent behavior of DAs and ODF2 in RPE1 cells. The levels of the indicated protein were measured at each centrosome (centrosomes 1 and 2) during interphase (inter), G2, prometaphase (pro), metaphase (meta), anaphase (ana), and telophase (telo) and were normalized to the average of interphase (marked by gray shading). Bar graphs represent mean ± SD. Numbers below the bars represent total number of cells analyzed in three or four independent experiments. A.U., arbitrary units; n.s., not significant. Significance probability values are: n.s., P > 0.05; *, P ≤ 0.05; **, P ≤ 0.01; ***, P ≤ 0.001; ****, P ≤ 0.0001.

