Figure 6.
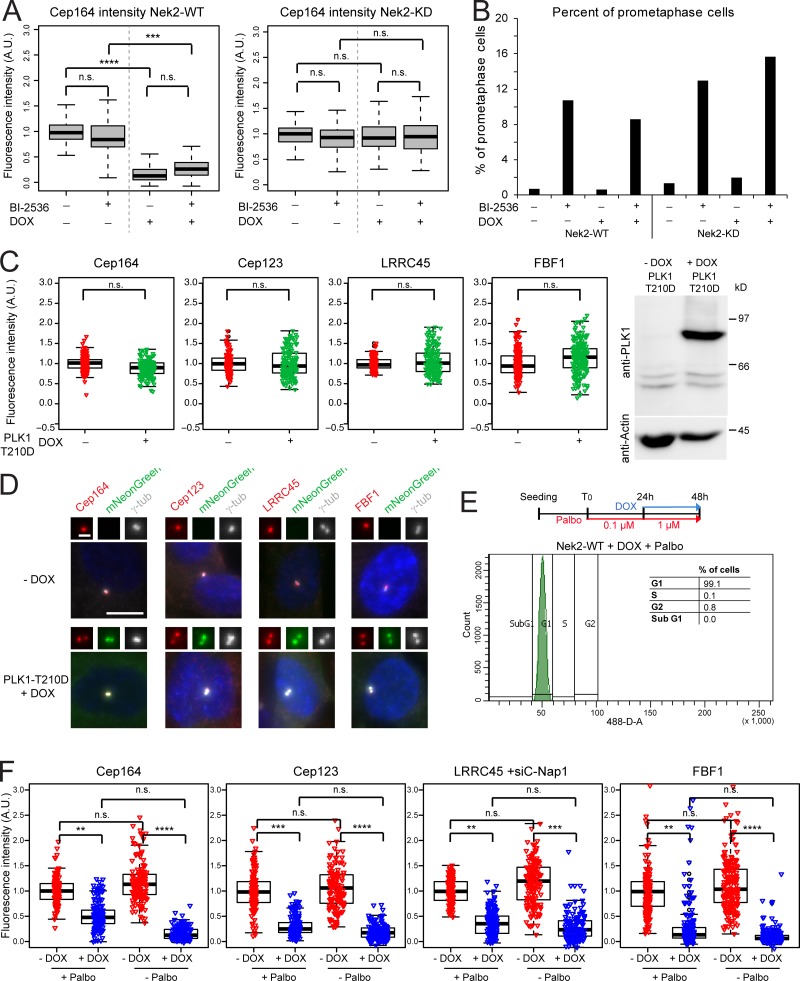
Nek2-dependent release of DAs is independent of Plk1. (A) RPE1 expressing mNeonGreen-Nek2A (Nek2-WT) or mNeonGreen-Nek2A-KD mutant (Nek2A-KD) under control of the DOX-inducible promoter were treated with solvent only (− DOX) or DOX (+ DOX) in the presence or absence of the Plk1 inhibitor BI-2536. Cells were analyzed using anti-Cep164 antibodies. Boxplots show the quantification of Cep164 signal at the centrosome after normalization to the − DOX − BI-2536 control. Boxes show interquartile range, lines inside the box represent the median, and whiskers show minimum and maximum values excluding outliers. Data from three independent experiments are shown. n = 250 cells per condition. (B) Percentage of prometaphase cells for experiment shown in A was quantified as a control for Plk1 inhibition (Sumara et al., 2004). n = 70 cells per condition. (C) Box/dot plots show the normalized intensities of the indicated proteins in RPE1 cells carrying the hyperactive mutant PLK1-T210D under control of the DOX-inducible promoter. Cells were treated with solvent (− DOX) or DOX (+ DOX). Dots represent individual cells, boxes show interquartile range, lines inside the box represent the median, and whiskers show minimum and maximum values excluding outliers. The graphs show the data from three independent experiments. n = 50 cells were analyzed per condition and experiment. Western blot shows the levels of PLK1-mNeonGreen ± DOX. Actin was used as a loading control. (D) Images show the signal of the indicated DAs (red) in RPE1 cells without (− DOX) or with (+ DOX) overexpression of mNeonGreen-PLK1-T210D. The insets represent magnification of the centrosome area. Scale bar, 10 µm. γ-tub, γ-tubulin. (E) Schematic diagram of the experimental procedure and quantification of the average of cells in G1 phase in three independent experiments analyzed by FACS (n = 37,487 cells). Graph shows a representative FACS plot for propidium iodide detection area (488-D-A). (F) RPE1 mNeonGreen-Nek2A–expressing cells were treated as described in E, and the indicated protein intensities at the centrosome were quantified. Dots represent individual cells, boxes show interquartile range, lines inside the box represent the median, and whiskers show minimum and maximum values excluding outliers. n = 150 cells per condition and protein in three independent experiments. γ-tubulin and DAPI serve as markers for centrosomes and nuclei, respectively. A.U., arbitrary units; n.s., not significant. Significance probability values are: n.s., P > 0.05; *, P ≤ 0.05; **, P ≤ 0.01; ***, P ≤ 0.001; ****, P ≤ 0.0001.

